
Is Central Indiana a good place to grow old? Are the basic needs of older adults in Central Indiana being met? What are emerging trends and issues related to older adults in Central Indiana?
Older adults are the fastest growing demographic in Central Indiana, as approximately 24,000 adults will turn 55 and 22,000 will turn 60 each year.1 By the year 2030, one in every five Hoosiers will be over the age of 65.2 To enhance the ability of older adults to live and thrive in Central Indiana, it is important to understand the population trends, notable changes, and basic needs of this growing demographic.
It is also important to acknowledge that older adults in Central Indiana experience aging differently based on their race, ethnicity, income levels, and other factors. Systemic inequity—which includes systemic racism and biases against age, gender, income, sexual orientation, and others—exists across multiple systems.3 These barriers are difficult to overcome without the support and influence of external entities to call out the negative efforts and identify solutions to address those issues.
The Central Indiana Senior Fund (CISF) in collaboration with The Polis Center at IU-I (Polis), IU Center for Aging Research (IUCAR), and IU Public Policy Institute’s (PPI) Center for Research on Inclusion and Social Policy developed a suite of information tools about the State of Aging in Central Indiana (SoA), including an annual report, issue briefs on emerging topics, and an interactive information portal (https://centralindiana.stateofaging.org).
SoA resources provide community leaders, decision-makers, older adult-serving entities, and philanthropic organizations with access to place-based information to help identify needed programs, funding, and policies. The aim is to inform discussion and prompt solutions that address the diverse needs of older adults in Central Indiana. The ultimate goal is to help older adults in Central Indiana have equal opportunity for a healthy, dignified and enjoyable life.
How to Use This Report
Purpose of report:
Initiated by the Central Indiana Senior Fund in 2018, the State of Aging in Central Indiana Report now serves as the go-to source of information related to aging in Central Indiana. This is a regularly updated report, along with its accompanying issue briefs and interactive online portal, that is intended to inform policy at state and local levels, influence the distribution of funds addressing older adult needs, and guide organizations as they work with older adults in their communities.
Approach:
The Polis Center at IU-I compiled regional and local-level data about the older adult population, including their demographics, basic needs, health and wellness, and challenges to aging in place. To validate the secondary data findings, Polis engaged multiple research partners to conduct key informant interviews and focus groups with service providers and policymakers throughout Central Indiana. Throughout this report, equity issues are interpreted as related to age, race, ethnicity, gender identity, and other characteristics that result in some groups of older adults experiencing challenges that others do not. The social-ecological model was used to highlight inequities from the individual level to the community and policy levels.

Section 1: Demographics
A growing population of nearly half a million adults age 55 and older lives in Central Indiana. This older adult population is not a monolithic group but varies by age group, race, ethnicity and household composition, socioeconomic status, and other characteristics. This section of the report presents key population trends and demographics highlighting the diverse nature of older adults in Central Indiana. Key findings include:
- Between 2020 and 2021, the older adult population in Central Indiana increased by 11,589.
- The number of older adults of color increased by 4,400 in Central Indiana and now make up 18 percent of the older adult The older adult population will continue to become more diverse as the more heterogeneous younger population ages.
- The older adult population in Central Indiana is increasing over four times the rate of the younger population.
- More than one-third of older adults in Central Indiana live alone.
- Older adults of color in Central Indiana are almost three times more likely to experience poverty compared to White older adults.

BASIC NEEDS
Section 2: Financial Stability
Financial stability is crucial for older adults to maintain a decent quality of life, age in place, and access critical resources. Whether an older adult is financially stable is influenced by life experiences and other characteristics. This section of the report assesses financial stability, including poverty levels, household income, basic living expenses, and the financial experiences of older adults in Central Indiana. Key findings include:
- All three older adult age groups in Central Indiana experienced significant increases in median household income between 2015 and 2021.
- Overall, one in 12 older adults experience poverty, with poverty rates similar between older adults in Central Indiana and Indiana as a whole. Although the median household income increased for older adults in Central Indiana between 2015 and 2021, there was not a significant change in their poverty rates.
- Black and Latinx older adults in Central Indiana are more likely to experience poverty than White older adults.
- Older women in Central Indiana are more likely to experience poverty than older Older women have an 8.9 percent poverty rate compared to the 7.2 percent poverty rate for older men.
- Nearly one in five adults of traditional retirement age continue to work outside the home.
- Healthcare and housing are the costliest expenses for older adults in Central Indiana.
- In 2021, over two in five older adults in Central Indiana reported experiencing at least some difficulty affording daily expenses or finding affordable health insurance.
- In general, Central Indiana is similar to Indiana in many measures of financial stability, but there are some notable differences, such as a greater percentage (26 percent versus 23 percent) of older adults in Central Indiana paying over 30 percent of their income on housing costs.
- Among older adults (age 55+) in Central Indiana, as age increases, income generally decreases.
Section 3: Food Insecurity
Food insecurity is a challenge for many older adults with low incomes. Nationally, one in ten households are food insecure, and the rate is even higher in Indiana. This section of the report discusses the breadth of food insecurity among Central Indiana’s older adults, including food access and barriers to food security. Key findings include:
- Almost 12 percent of Central Indiana residents age 50-59 were food insecure in 2021. This remained steady even as the national rate has declined since 2018. Almost 8 percent of Central Indiana residents age 60 and older were food insecure in 2021. This declined from approximately 10 percent in 2018.
- According to older adults and service providers, the chief barriers to food access and security are transportation and money.
- Less than ten percent of Central Indiana older adults live in a food The rate is highest in Marion and Shelby Counties. There are 3,300 fewer Marion County older adults in food deserts in 2022 compared to 2021. However, during the same period, the number of older adults living in food deserts in the other counties increased by 2,900.
- The Federal Supplemental Nutrition Assistance Program (SNAP) provides necessary benefits to older adults experiencing poverty, yet only half of eligible adults age 60 and older participate in the program.

Section 4: Housing
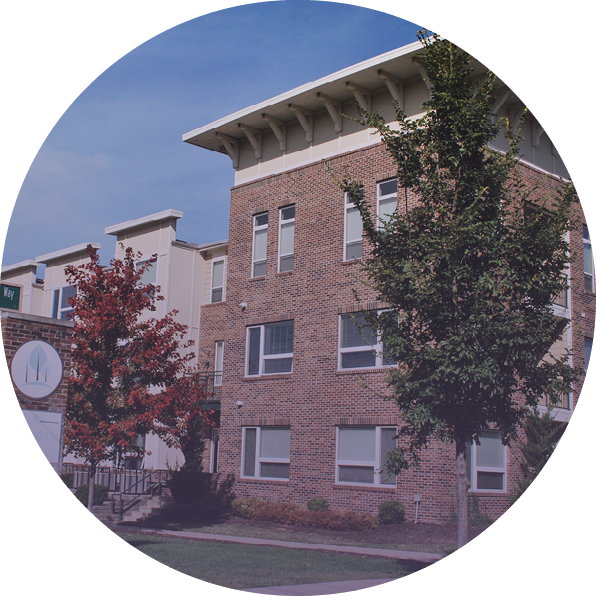
Housing is an important issue among older adults, as housing costs comprise a significant proportion of household expenses and can cause financial stress for adults about to experience or already experiencing a decline in income. This section of the report discusses housing affordability, homeownership, housing instability, and barriers to obtaining housing in Central Indiana. Key findings include:
- More than half of older adult renters in Central Indiana are housing cost-burdened paying more than 30 percent of their income toward housing.
- In Central Indiana, while 23 percent of White older adult households (owners and renters) are housing cost- burdened, that rate is 41 percent among Black households.
- The housing cost burden rate for Latinx older adults improved from 36 percent in 2015 to 26 percent in 2021 in Central Indiana.
- Twenty-two percent of Central Indiana’s older adult households rent and the other 78 percent own their home. Among those homeowners, 32 percent have paid off their mortgage.
- Twenty-five percent of Marion County adults experiencing homelessness were over the age of 55, while six percent of those individuals were over the age of 64.
- The number of Marion County residents experiencing homelessness declined by eight percent between 2022 and 2023.
Section 5: Safety and Abuse
Perceived personal safety may be crucial for older adults to age in place with a positive outlook. However, safety varies based on where one lives and the resources one has for maintaining social support and effective caregiving. This section of the report describes elder abuse and crime, including perceptions and experiences affecting the physical safety of older adults. Key findings include:
- Nationally and in Indiana, about one in ten adults age 65 and older experiences abuse each year, and this is likely underreported.
- In 2021, 12,806 older adults in Central Indiana were victims of fraud, property crime, or violent crime.
- Between 2017 and 2021, older adults in Central Indiana reported increases in fraud and scams.
- In 2021 compared to 2017, more older adults in Central Indiana were concerned about “being the victim of a crime,” but also feel more positively about safety in their own community.
Section 6: Transportation
Access to transportation is important because it empowers older adults to maintain their independence.Transportation opportunities for older adults may take different forms, including driving, public transportation, ride-share service, or shuttle buses. This section of the report discusses public transportation access and perceived transportation barriers. Key findings include:
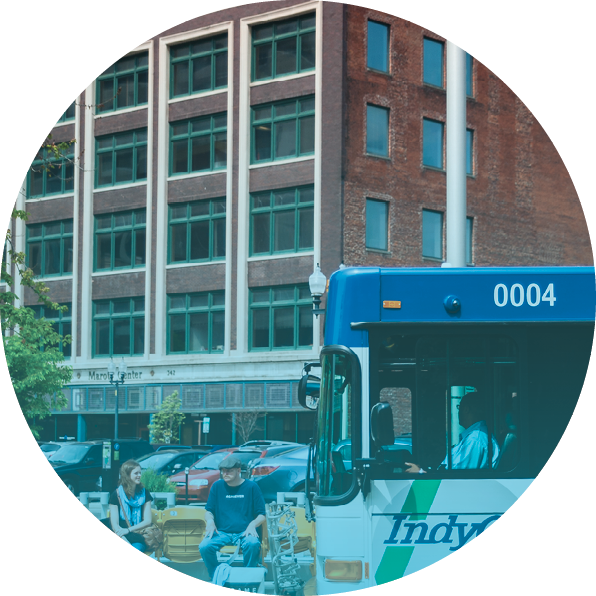
- In Indianapolis, approximately 76,000 people age 65 or older live too far away from an IndyGo stop to likely use transit. That represents nearly two thirds of people age 65 or older in Indianapolis.
- Less than one in five older adults in Central Indiana positively rate the ease with which they can use public transportation in their communities.
- In Indianapolis, one in three older adults live in a neighborhood with minimal or no public transportation service.
- IndyGo plans to improve service through its future service plan (2023- 2027). This is likely to help increase access for older adults who live along pre-existing routes.
- Forty-two percent of adults age 65 and over who ride IndyGo public transit in Marion County would not be able to make their trip without IndyGo available as a service.
LIVING IN THE COMMUNITY
Section 7: Aging in Place
Most adults wish to remain in their own homes as they age, rather than moving to an institutional setting. To accomplish this, it is important for older adults to have the means to maintain a home, perform activities of daily living, and feel comfortable in their communities. This section of the report discusses aging in place in both homes and communities. Key questions and findings include:
WHO MAY NEED ASSISTANCE TO AGE IN PLACE?
- In Central Indiana, 18 percent of individuals age 55-64 have a disability. The disability rate increases to 29 percent for those age 65-84 and to 66 percent for those age 85 and over.
ARE INDIVIDUALS AWARE OF AVAILABLE SERVICES AND SUPPORTS?
- Only one-quarter of older adults in Central Indiana say information is available about services to assist them with remaining in their homes and communities as they age.
IS CENTRAL INDIANA A GOOD PLACE FOR OLDER ADULTS TO LIVE?
- Most older adults in Central Indiana (84 percent) believe their communities are a good place to live. However, a majority of older adults feel negatively about built environment issues such as the availability and accessibility of high- quality housing, public spaces, mixed-use neighborhoods, and public transit.
Section 8: Social Well-being
The social wellbeing of older adults is dependent on positive, durable relationships and sustained access to community roles and social institutions. This section of the report discusses social inclusion and purposeful living. Key findings include:
- Two out of five older adult households in Central Indiana consist of someone living alone.
- One in three older adults in Central Indiana report feelings of loneliness or social isolation.
- About half of older adults in Central Indiana report having opportunities to participate in community matters, while 14 percent report having used a senior center in their community.
- In Indiana, disability is one of the biggest contributors to isolation in older adults.
HEALTH AND WELLNESS
Section 9: Health Outcomes
Many older adults deal with chronic diseases, like cancer and cardiovascular- related issues, increased disability, and increased susceptibility to lower- respiratory problems. These conditions can be exaggerated by social stressors and lifestyle factors, and they place older adults at increased risk from COVID-19. This section of the report discusses mortality rates, rates of disease, notable changes, and disparities in the health of Central Indiana’s older populations. Key findings include:
- While for the US and Indiana, the COVID-19 mortality rate for those age 55 and older continued to increase dramatically between 2020 and 2021, in Central Indiana the upward trend leveled off between 2020 and 2021.
- In 2021, COVID-19 continued to increase health outcome disparities between Black and White older adult populations.
- There was increased older adult mortality in Central Indiana due to Alzheimer’s disease and diabetes and a halt to the previous decline in mortality due to cancer and heart disease.
- Suicide rates are rising among older men in Central Indiana.
- Cancer remained the leading cause of death for younger- and middle-old adults in Central Indiana.
- Deaths from falls, drug overdose, and suicide have continued to increase in older adults in Central Indiana, matching state and national trends.
Section 10: Health Care
The health-related needs of older adults are often more complex because of advanced chronic disease and associated disability and require additional attention to care coordination. This section of the report discusses the availability and use of health care and of home- and community-based services. Key findings include:
- Low-income and other vulnerable Medicare recipients in Central Indiana visit hospitals and emergency rooms more frequently than other Medicare recipients.
- Providers identify falls, mental health, dementia and fragmented care as issues that need more resources and attention.
- Between 2020 and 2022, the number of geriatric providers per 100,000 adults age 65+ increased by 30 percent in Indiana, but rural areas are still lacking health care providers.
- The number of home health workers per 1,000 adults age 65 and older is only 34 in Indiana, well below the national average of 60.
- Most older adults in Central Indiana feel preventative and physical health care is broadly available, but the share who have problems affording health care is on the rise, according to a 2021 survey.

Section 11: Caregiving
Caregiving by and for friends and loved ones is an important part of most older adults’ lives. Caregiving impacts the well- being of both those being cared for and those providing care. This section of the report discusses caregiving by and for older adults, including the benefits, risks, and associated resources. Key findings include:
- Four out of five older adults in Central Indiana reported assisting a friend, relative, or neighbor.
- One third of older adults in Central Indiana provide care to someone age 55 or older.
- In Indiana, there was an estimated $10.8 million in unpaid caregiving services provided for family members in 2021, covering 740 million care hours.
- As many as one fifth of older adults in Central Indiana are physically, emotionally, or financially burdened by caregiving responsibilities.
- Between 2017 and 2021, there was a decline in the share of older adults in Central Indiana reporting caregiving at least one hour per week for other older adults and for other individuals in general.
- The pandemic took a significant toll on caregivers’ mental health. Among respondents to a national survey, at least half report adverse mental health conditions such as anxiety, depression, or PTSD. Furthermore, around 30 percent of caregivers considered suicide.

EQUITY FRAMEWORK
Older adults in Central Indiana experience aging differently based on their race, ethnicity, income levels, and other factors. While this information is crucial for identifying trends and informing decisions, it is a preliminary step toward understanding the root causes of inequity.
Systemic or institutional racism includes racist activities that move beyond individual-level actions and are embedded into organizational or societal practices. We focus on systemic inequity, which includes systemic racism, as well as biases against gender, income, sexual orientation, and others that exist across multiple systems. These practices are difficult to overcome without the support and influence of external entities, funds, and attention. For example, lesbian, gay, bisexual, transgender, and queer or questioning (LGBTQ+) older adults in Central Indiana report experiencing discrimination in group housing that does not fully consider sexual orientation and gender identity.4 That situation is an example of systemic inequity when there is no systemic effort within or among these housing providers to recognize the identity of LGBTQ+ older adults in a way that makes them feel safe and that ensures their comfort.
The social ecological model is a common framework used to identify the influences on individuals’ outcomes, and the fact that they occur at different levels of society. While this framework is commonly used in the public health arena, it is multidisciplinary in nature.5 6 7 For the purpose of this report, the social ecological model has been adapted as a framework for examining inequitable outcomes for different communities of older adults, and for capturing the systemic nature of the inequities they face.
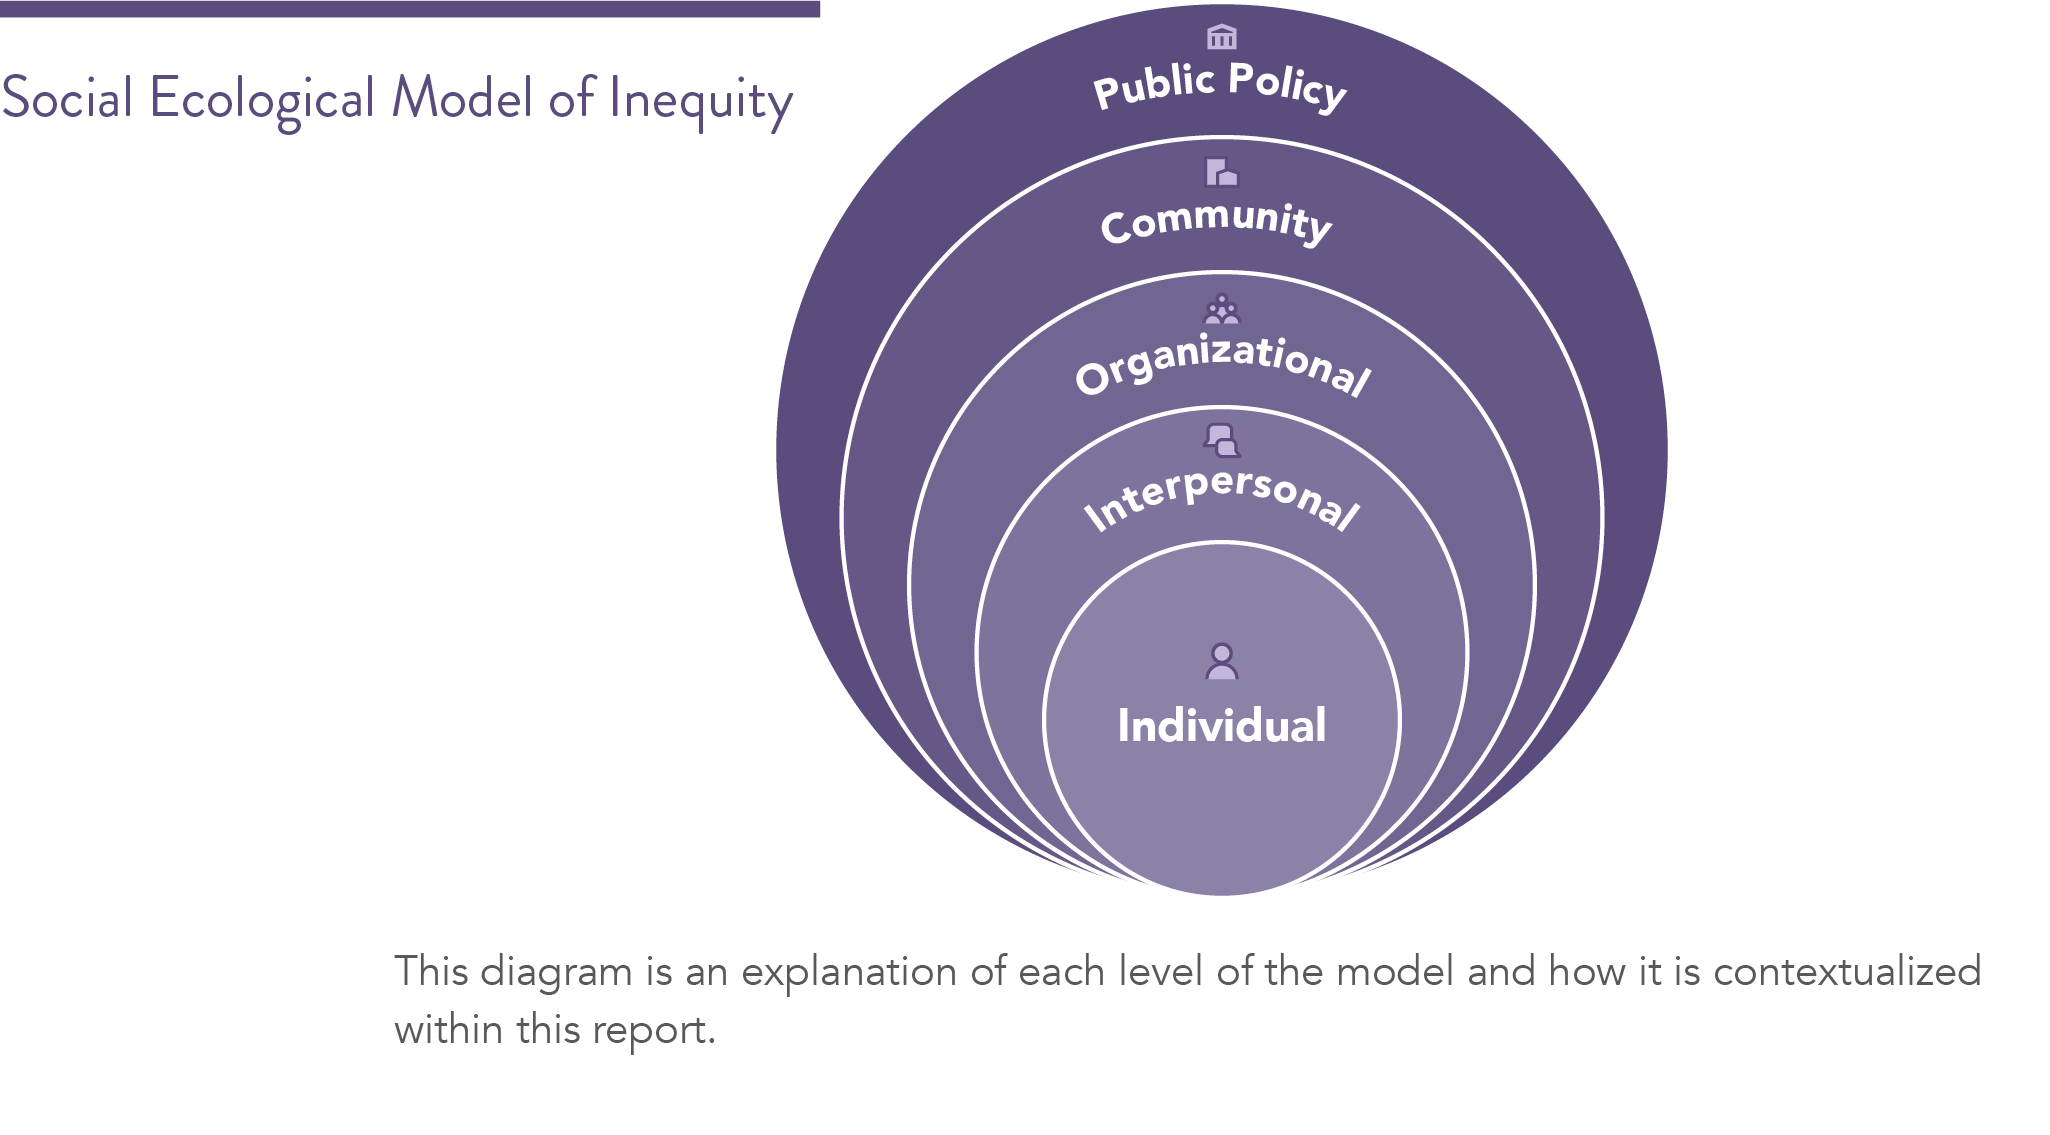
- Inequitable Trends: These areas focus on general trends among each group that are influenced by systemic inequity, but largely reinforced at individual and group levels.
- Individual: Most work focuses on this level. Specifically, this level can be discussed as the individual-level differences experienced within and compared to other groups. From an inequity perspective, these experiences include direct implicit bias or personal experiences. We discuss these issues by highlighting key trends across and within certain populations, as well as opportunities to acquire or practice skills, experiences or decisions that some groups of people may have access to while others do not.
- Interpersonal: This level refers to the friends, family and social networks of older adults. Inequity may appear through interpersonal networks that present disproportionately complex decisions or experiences for certain populations (e.g., families of color are more likely to live in intergenerational households).
- Systems: This level engages gaps for which individuals or communities have substantially less agency, and where external support is crucial for creating meaningful, lasting change.
- Organizational: Organizations, such as workplaces and service providers, can contribute to inequity by not providing services tailored to specific populations, especially if they are at risk of obtaining poor outcomes. When older adults rely on specific services or engagement with different organizations, these experiences can have negative effects that perpetuate inequitable outcomes.
- Community: This level refers to how communities are designed, how older adults feel about their physical access to community spaces, facilities, and resources, and older adult physical connectedness within their neighborhood, city, or region. Older adults may experience systemic inequity in communities because they often lack individual control over the ability to access transportation, safe sidewalks, or food. This may vary by the racial/ethnic or income composition of one’s community. These community-level experiences are often reinforced by organizational-level inequities and by public policies that actively or passively reinforce inequitable conditions in communities.
- Public Policy: This final level frequently influences the other levels, as it refers to policies and laws that can guide community structures, organizational resources, and individual and group-level experiences.
Each section in this report highlights quantitative and qualitative data trends that indicate not just inequities in outcomes for older adults, but inequities and gaps in services, policy decisions and community-wide resources. The goal of this framework is to inform opportunities for investment, advocacy, and greater engagement with groups that may benefit from support to more equitably serve older adults.
Where different, relevant levels of the model are highlighted within each chapter, a designation will be provided to easily identify the level of the model being discussed. We hope that this structure will not only illuminate the inequitable gaps in our systems, but also highlight opportunities to address and improve the experiences of older adults in more equitable ways.
- U.S. Census Bureau, “2015-2019 American Community Survey 5-Year Estimates,” 2021.
- Rachel Strange, “Indiana’s Elderly Population Projected to Climb Sharply,” August 2018, http://www.incontext.indiana.edu/2018/july-aug/article2.asp.
- The Aspen Institute, “Glossary for Understanding the Dismantling Structural Racism/Promoting Racial Equity Analysis,” n.d., https://www.aspeninstitute.org/wp-content/uploads/files/content/docs/rcc/RCC-Structural-Racism-Glossary.pdf.
- Nine focus groups with older adults were conducted during 2019 and 2020 to collect input on issues facing the older adult population in Central Indiana. The focus groups composed of older adults were assembled with the identification and recruitment assistance of community service providers. These focus groups were conducted by researchers, in person prior to the COVID-19 pandemic, and by Zoom after the pandemic began. The questions asked of the focus group participants were discussed and agreed upon by research faculty and staff.
- Shelley D. Golden and Jo Anne L. Earp, “Social Ecological Approaches to Individuals and Their Contexts: Twenty Years of Health Education & Behavior Health Promotion Interventions,” Health Education & Behavior 39, no. 3 (June 1, 2012): 364–72, https://doi.org/10.1177/1090198111418634.
- Jennifer Gregson et al., “System, Environmental, and Policy Changes: Using the Social-Ecological Model as a Framework for Evaluating Nutrition Education and Social Marketing Programs with Low-Income Audiences,” Journal of Nutrition Education 33 (September 1, 2001): S4–15, https://doi.org/10.1016/S1499-4046(06)60065-1.
- Centers for Disease Control and Prevention, “The Social-Ecological Model: A Framework for Prevention,” January 29, 2021, https://www.cdc.gov/violenceprevention/about/social-ecologicalmodel.html.
- University of Washington School of Medicine, “Social Ecological Model | Ecology of Health and Medicine,” August 12, 2017, https://blogs.uw.edu/somehm/2017/08/12/social-ecological-mod- el/
- Lori Heise, Mary Ellsberg, and Megan Gottemoeller, “Ending Violence Against Women,” Popu- lation Reports 27, no. 4 (December 1999).
