Housing
Housing is an important issue among older adults (those age 55 and older), as housing costs comprise a significant proportion of household expenses and can cause financial stress for those adults about to experience or already experiencing a decline in income.
Persona
Anthony
60 years old
U.S. Army veteran
Part-time cashier
Anthony is a single, Black U.S. Army veteran who lost his job as a supermarket shelf stocker nearly a year ago, after chronic pain in his feet left him unable to do the work. Anthony found a part-time job as a cashier at a local convenience store, where he’s able to sit on a stool behind the counter most of the time. At age 60, he is still two years away from collecting Social Security benefits, and the income from his cashier job wasn’t enough to cover his rent plus food and other expenses, so he has been living out of his car for three months. Anthony has found a few, small rental units that he likes and could afford, but his applications have been rejected because of a misdemeanor conviction for “disorderly conduct” more than 15 years ago. That involved a bar fight, for which he served three months on probation. He suspects that there is also an unspoken bias against him because of his race—and because he cannot provide a current address—on the rental application forms. Anthony is hopeful about a low-income housing program that he’s applied to, which gives priority to veterans. However, he’s been told there is a large applicant pool, and the first units are several months away from being ready. Anthony hopes and believes that he can hang on for two more years, when Social Security benefits will help ease his financial burden. In the meantime, his car needs repairs, and if he sold it he would lose both his shelter and means of getting around. His plan for the worst-case scenario is to go without a car, move into a mission run by a local religious organization, and wait to begin receiving Social Security benefits.

Persona
Bob and Marjorie
Early 80s
Retired from auto-parts manufacturer
Paid off their mortgage
Bob and Marjorie are a White couple in their early 80s living on income from Social Security and a pension from Bob’s two decades of working for an auto-parts manufacturer in Indianapolis. They own a home on the city’s southwest side. Both are in relatively good health, although Bob has diabetes and they pay some of the costs for his insulin and other medications. Bob and Marjorie paid off their mortgage nearly a decade ago, but the house needs frequent repairs. Their son, who lives nearby, helps out with small chores like cleaning the gutters, mowing the lawn, raking leaves, and other upkeep. Now the house needs a new roof—a project that’s too big for them to ask him to help with, even if he had the skills. They are wary of making a big investment in their home—both because of the cost and because of their age. They have friends who moved into an assisted living community years ago, and report being happy with it. Bob and Marjorie have slowed down considerably over the past few years—it’s harder to stay on top of the basics, like grocery shopping and light housecleaning—and they’re interested in the assisted-living option. But moving into the community would wipe out their savings in about three years, and their pension and Social Security benefits alone are too little to cover the cost. Although things are fine for the moment, Bob and Marjorie worry about where they will live and how they will afford it—especially if their mobility and self-sufficiency decline significantly.

Housing is an important issue among older adults, as housing costs comprise a significant proportion of household expenses and can cause financial stress for adults about to experience or already experiencing a decline in income. This section of the report discusses housing affordability, homeownership, housing instability and barriers to obtaining housing in Central Indiana. Key findings include:
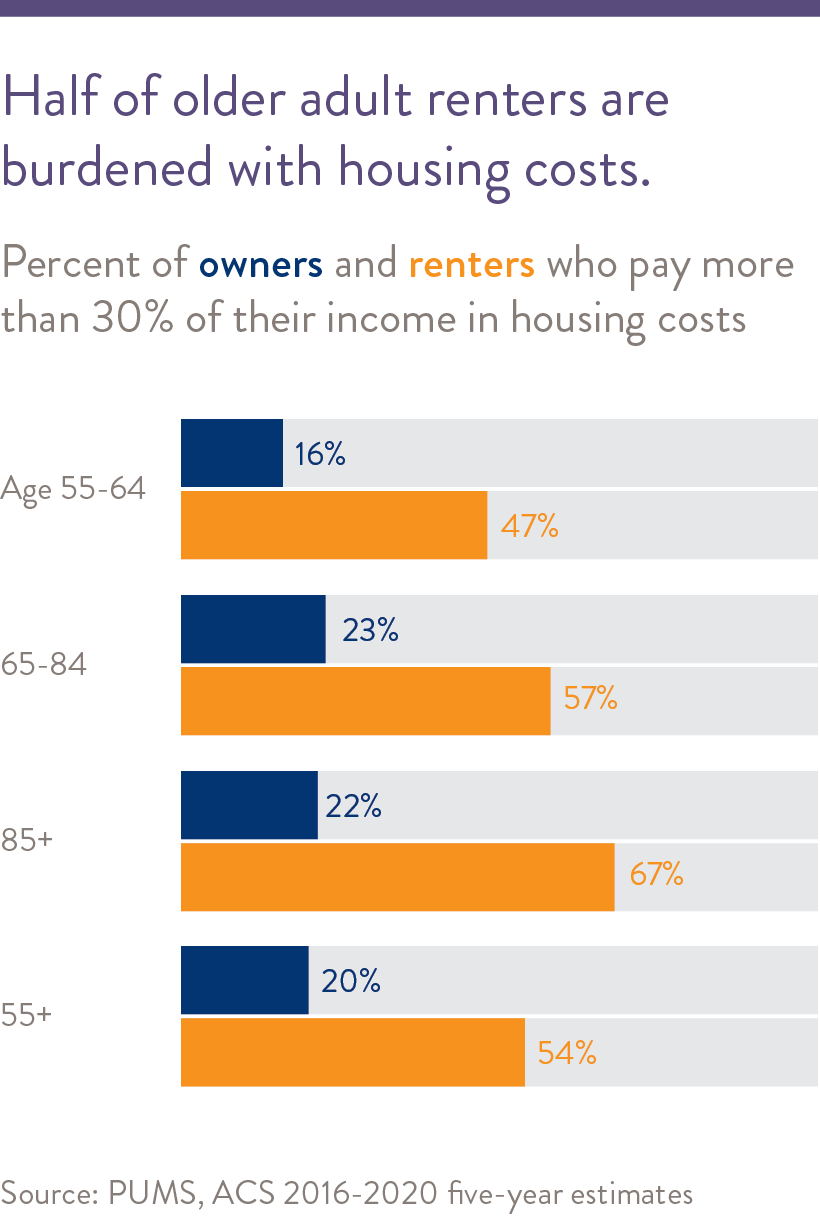
- More than half of older adult renters in Central Indiana are burdened by housing costs, paying more than 30 percent of their income toward housing.
- In Central Indiana, while 24 percent of White older adult households (owners and renters) are housing cost burdened, that rate is 43 percent among Black households.
- The housing cost burden rate for Latinx older adults improved from 36 percent in 2015 to 26 percent in 2020 in Central Indiana.
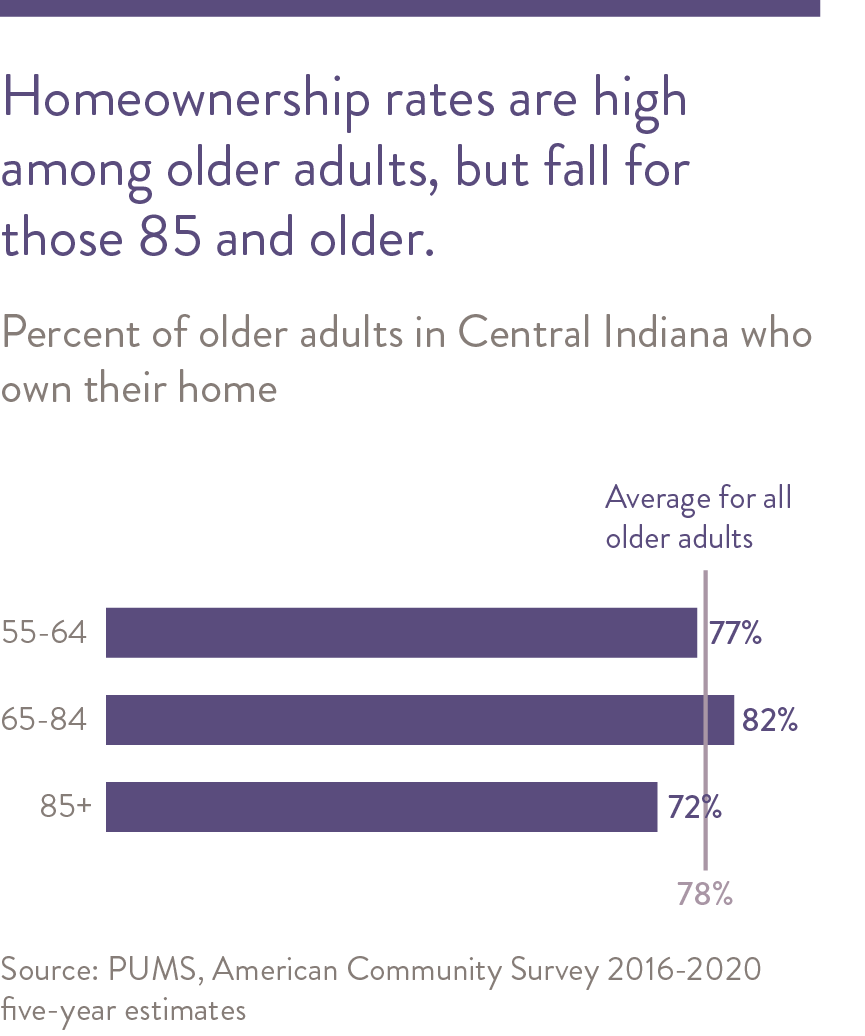
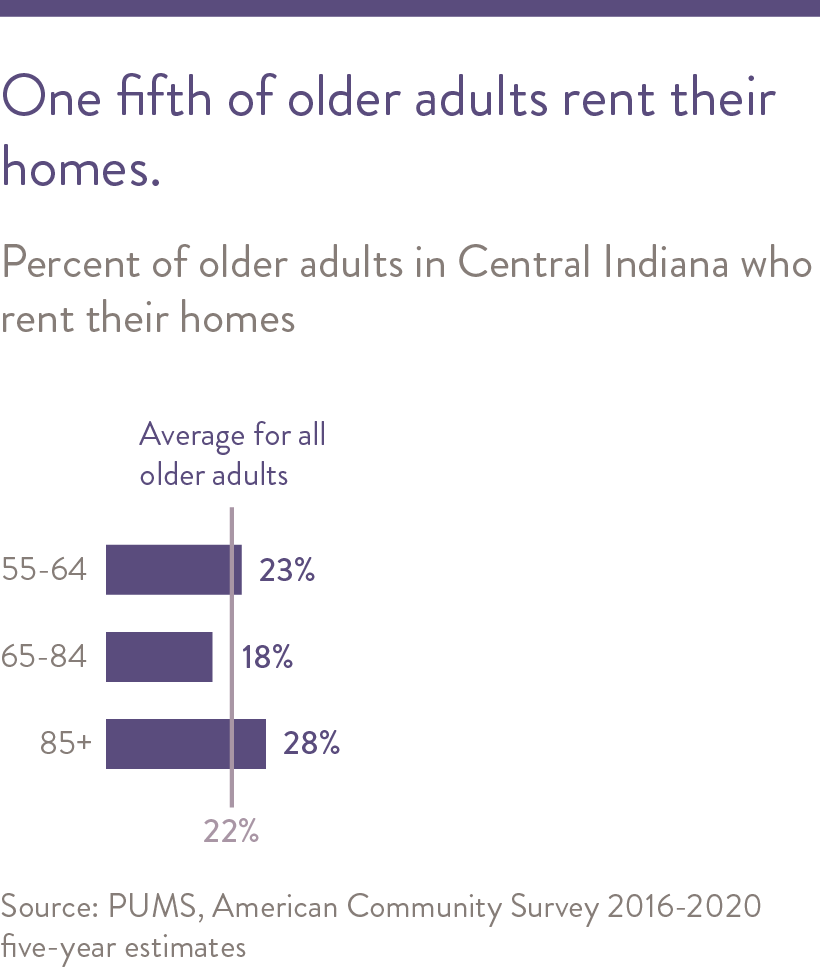
- Twenty-two percent of Central Indiana’s older adult households rent. The other 78 percent own their home. Among those homeowners, 41 percent have paid off their mortgage.
- One third of Marion County adults experiencing homelessness are age 50 and older. This represents a six point decrease in the share of homeless individuals that are age 50 or older.
- The number of Marion County residents age 62 or older experiencing homelessness declined by 30 percent between 2021 and 2022, the largest drop in six years.
The Burden of Housing Costs
Housing affordability affects the ability of older adults to live stably and age in place across a variety of living quarters. Housing affordability affects older adults, from those who own their own homes to those who rent or experience housing instability. Because housing and housing-related costs represent a large proportion of the typical household budget, these costs can place a great deal of financial stress on older adult households. See the Financial Stability section of this report to learn more about older adult household expenses.
A household is considered housing cost-burdened when 30 percent or more of its income is spent on housing costs, and severely cost-burdened when 50 percent or more of its income is spent on housing costs.1 2 In 2016-2020, 27 percent of older adults in Central Indiana were housing cost-burdened, and 13 percent were severely cost-burdened.3 4 As noted in the chart, the rate for older adult renters was nearly triple the rate for older adult homeowners.
In Central Indiana in 2020, 54 percent of older adult renters were housing cost-burdened and 27 percent were severely housing cost-burdened, a decline of three percentage points since 2015. Thirty percent of renters were severely housing cost-burdened, which has not changed significantly since 2015.5 While there are few significant differences between renters of different age groups, a smaller proportion of younger-old renters are housing cost-burdened than are middle-old and oldest-old renters (47 percent compared to 57 percent and 67 percent, respectively). Similarly, renters age 85 years and older are more likely to be severely housing cost-burdened (47 percent) than both younger-old and middle-old renters (both 27 percent).6 This is pattern is consistent with decreases in income and increases in poverty when moving from younger to older age groups, as discussed in the Financial Stability section of this report.
Meanwhile, one in five Central Indiana homeowners age 55 and older was housing cost-burdened in 2020, a 2.2 percent decrease since 2015. Nine percent of older adult homeowners were severely housing cost-burdened in 2020, which did not change significantly from 2015. Younger-old adults were significantly less likely than middle-old adults to be housing cost-burdened (16 percent versus 23 percent)., Older adults who already experience housing cost burden also experienced the financial impact of the COVID-19 pandemic. Those who rely on earned income or the income of others in their households to pay the rent may have faced housing instability in the wake of income loss, which disproportionately impacts households with lower incomes.7 8
Older adults of color in Central Indiana are disproportionally more likely to be housing cost-burdened. According to 2020 data, Black older adults and those of multiple or other races are significantly more likely to be housing cost-burdened than White older adults. The estimated share of Latinx older adults that are burdened by housing costs has fallen by 10 percentage points since 2015, making that group not significantly different from White older adults.
The cost of housing maintenance also affects the affordability of housing. Older adults in focus groups reported not being able to maintain their homes or properties and may not be able to afford to hire someone to do this maintenance for them. Some feel uncomfortable continually asking children or relatives for help cleaning gutters, mowing lawns, trimming trees or making other repairs. Finding home and property maintenance businesses that are trustworthy also affects access to these services. Those with Internet access use resources such as the Better Business Bureau to ascertain the trustworthiness of a company. One woman noted that she asks people from church to help her, because if they do a good job at these tasks at church, they will do so at her home.
Black older adults households are much more likely to be burdened by housing costs than other races.
Share of householders age 55 or older paying more than 30% of income toward housing (Central Indiana)
To help offset housing costs, older adults reported using programs like the Low-Income Energy Assistance Program (LIHEAP) to help offset housing costs, but this program has experienced federal budget cuts. It is also a one-time benefit that will not cover the costs of all energy bills, and LIHEAP and similar programs require substantial documentation that some older adults may lack. An average of 11,000 older adults are served by this program annually in Central Indiana.9 10 A limited amount of weatherization assistance is available to Central Indiana residents through the state government. Between 2012 and 2019, there were 93 older households per year that completed weatherization repairs.11 Lastly, older adults in focus groups reported using services to make their homes more accessible, which is important to supporting aging in place. Lastly, older adults in focus groups reported using services to make their homes more accessible, which is important to support aging in place.
Availability of Affordability, Quality Housing
The Community Assessment Survey for Older Adults (CASOA) identifies the strengths and needs of Indiana adults age 60 and older, including in the Central Indiana region. In 2021, only 30 percenet of Central Indiana respondents indicated that the availability of affordable quality housing in their communities was either excellent or good for those in their age group.12 13 This is a 10 point decline from 2017, perhaps representing respondents’ perceptions of increased housing prices. Indiana also experienced a decline between 2017 and 2021 (42 percent to 38 percent), albeit not as great as Central Indiana’s decline in perceptions of affordable housing.
One means of ensuring a quality supply of affordable housing earmarked for older adults is by using federal and local resources to leverage or directly finance the construction of affordable housing, typically multifamily rental housing. Federal programs related to these are often funded or guaranteed by the U.S. Department of Housing and Urban Development (HUD), along with funding through programs such as the Low-Income Housing Tax Credit (LIHTC) program, the Community Development Block Grant HOME program, bond financing guaranteed by municipalities, states or the federal government.14
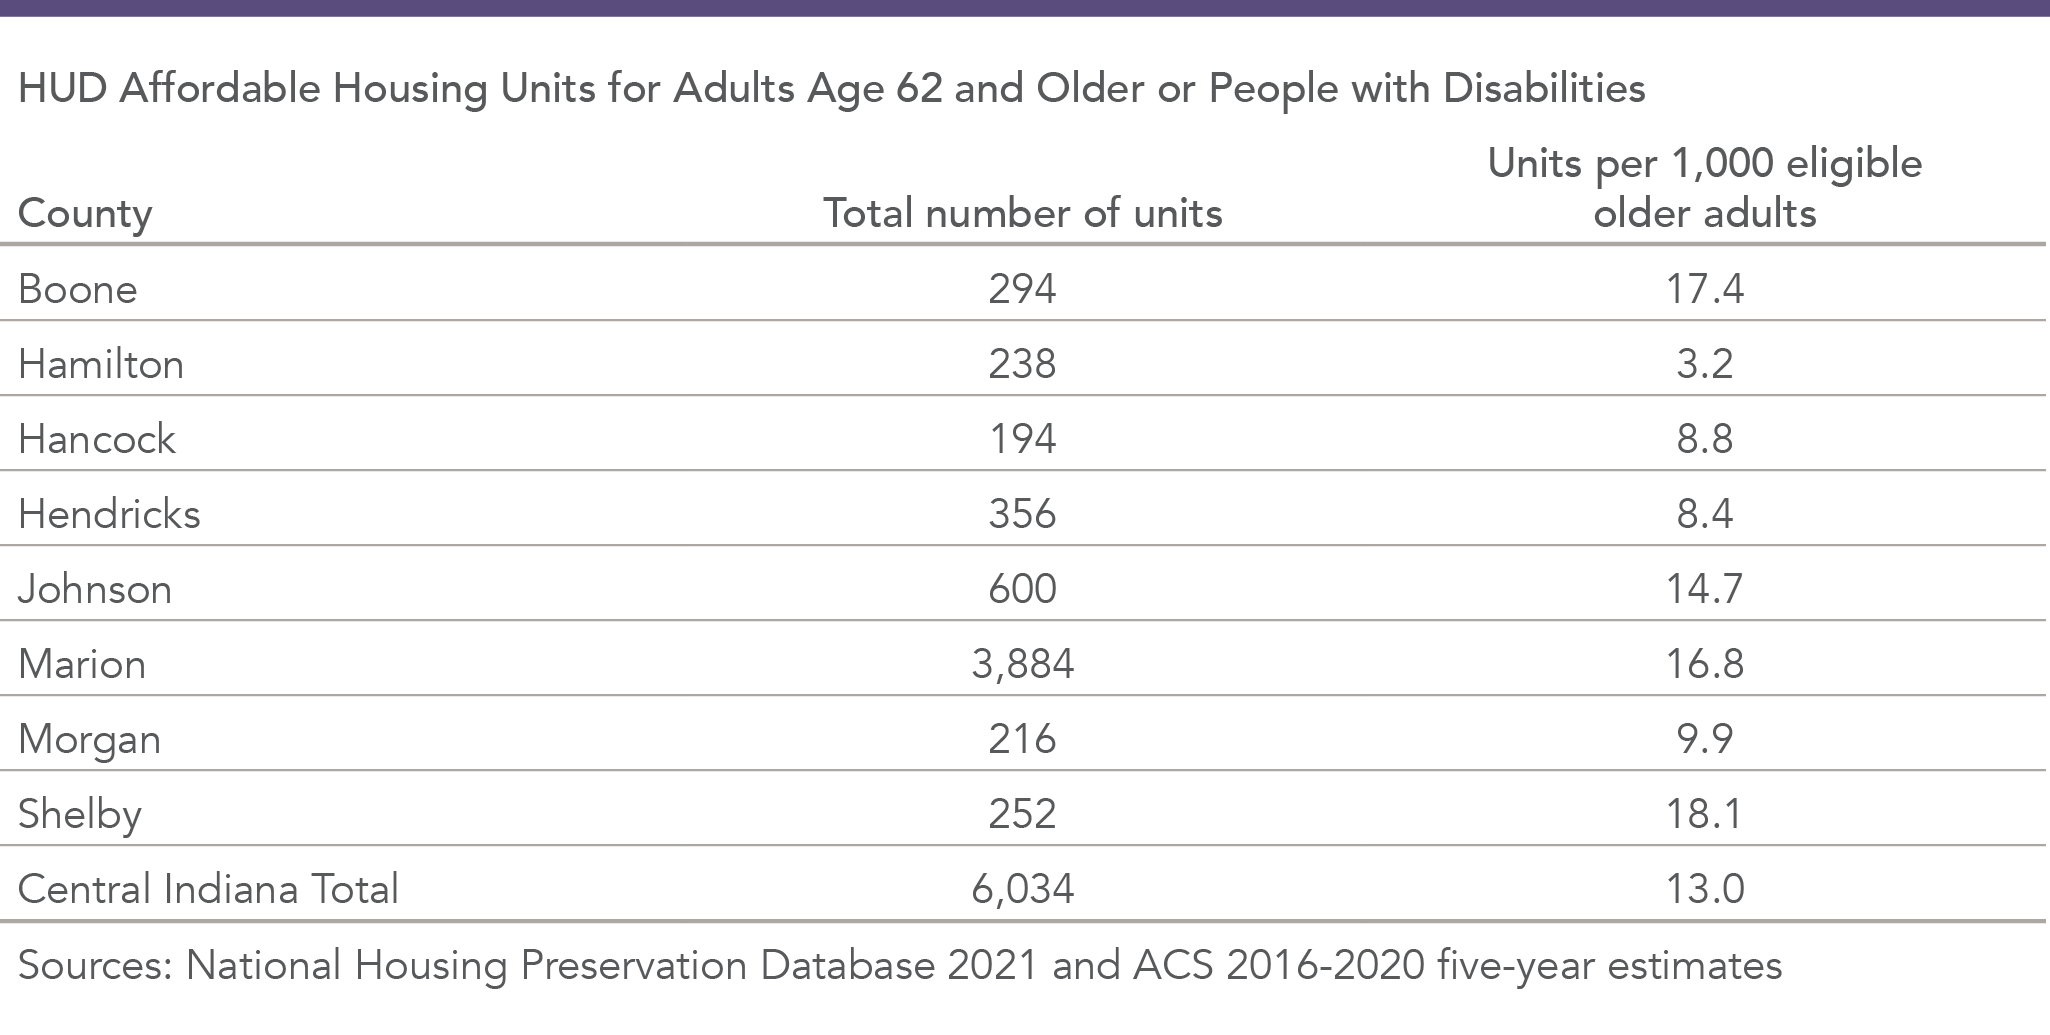
Federally subsidized affordable rental housing for older adults is typically limited to those age 62 and older, and is sometimes also available for people with disabilities, regardless of age. To qualify for an affordable unit, a household must fall at or below a specific income level based on household composition.15 Central Indiana is home to a total of 95 HUD-funded or financed affordable housing developments, totaling 6,034 units.16 This is a decline of 170 units between 2018 and 2021. Many subsidized units are funding through Low-Income Housing Tax Credits, which require affordable rents for a certain period of time. As these requirements expire, the units return to market rate and the number of subsidized units is reduced. Marion County has the largest number of units, 3,884 (16.8 per 1,000 older adults). Johnson County has the highest concentration of units, at 18.1 units per 1,000 eligible older adults. Hancock County has the fewest number of affordable housing units (194 units), while Hamilton has the least number of units per 1,000 eligible older adults, at 3.2 units.17 18
Although most older adults in Central Indiana own their homes, renters comprised 22 percent of older adult households in 2016-2020.19 Twenty-three percent of younger-old households live in rental units, compared to 18 percent of middle-old and 28 percent of oldest-old adults. A focus group at a low-income housing community for older adults indicated that their experiences were quite different from older adults who own homes. They reported substantially more financial instability and limits in housing options. Additionally, they expressed greater reliance on resources provided through the housing community for transportation, recreation, and food than other older adults. Rental units for older adults can be subsidized through federal funding mechanisms, such as Section 42 housing, but key informants report these have long waiting lists.20 Additionally, many older adults must be at least 62 years old to be eligible for certain types of affordable housing units. A lack of eligibility creates a gap in services, particularly for the younger-old, which one key informant reported as “living in filth and squalor” because of the low quality of the units that they can afford.
Housing Affordability and Neighborhood Inequities
The socioeconomic status of a neighborhood is related to residents’ health and social outcomes. Adults living in high-poverty neighborhoods are more likely to experience chronic illness, mobility issues, cognitive impairment and accelerated aging, regardless of income level. Because both Latinx and Black older adults are more than twice as likely as White older adults to live in high-poverty neighborhoods regardless of income, the former face increased poverty-related risk of chronic illness, limited mobility, cognitive impairment and accelerated aging.21
Older adults participating in focus groups reported that in some Indianapolis neighborhoods, changing demographics over time led to a reduction in property values, while others reported that gentrification and subsequent rising property values led to unaffordable property taxes.22 According to the older adults, both phenomena resulted in many long-term residents moving away from these neighborhoods. In 2021, 31 percent of older adults surveyed in Central Indiana reported that having enough money to pay their property taxes was at least a minor problem during the past year, representing a 11 point increase since 2017.23
Homeownership
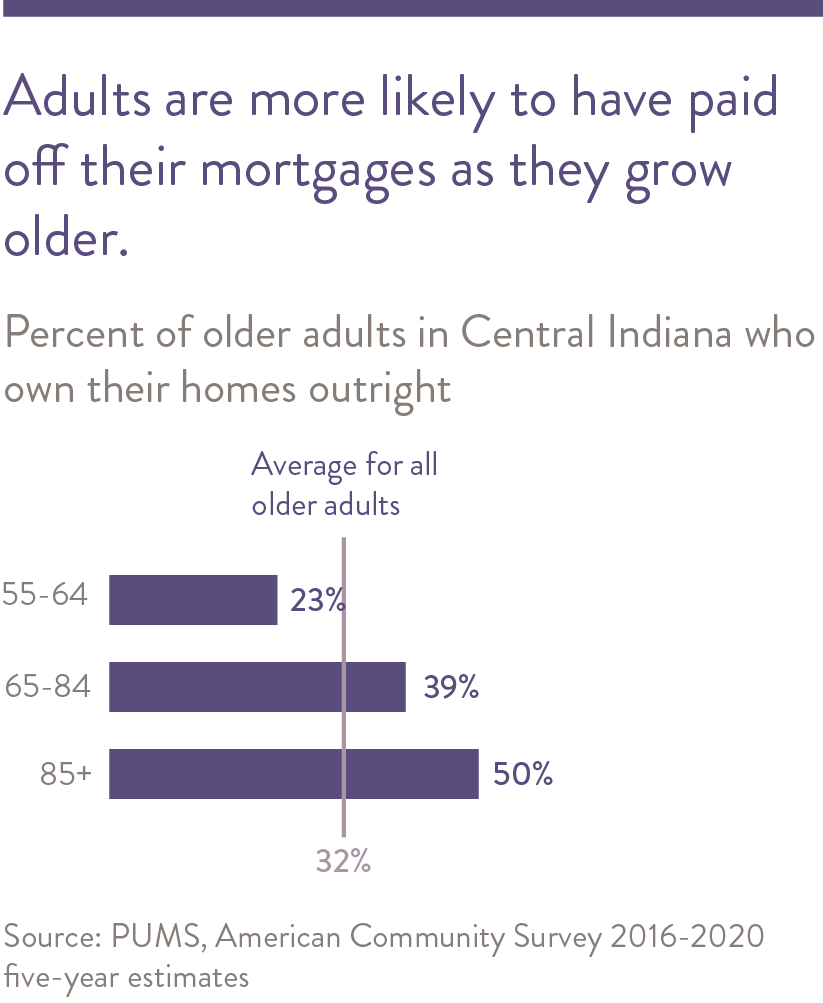
In 2020, the homeownership rate among older adults in Central Indiana was 78 percent. This rate varied among different age ranges. The younger-old age group had a homeownership rate of 77 percent, the middle-old age group had a homeownership rate of 82 percent and the oldest-old age group had a much lower homeownership rate of 72 percent.24 Housing costs for older adult households are lower when they own their own homes and do not have a monthly mortgage payment. Among older adults in the Central Indiana region, the proportion of homeowners without a mortgage is 32 percent. This proportion increases as age increases: 20 percent of the younger-old, 41 percent of the middle-old and 52 percent of the oldest-old own their homes outright.
Not all Central Indiana households are equally likely to own their homes. While 82 percent of White older adults are homeowners, only 54 percent of Black older adults and 60% of Latinx older adults own their own homes.25 These proportions explain why Black and Latinx older adult households are more likely to experience housing cost-burden than White older adults.
Housing Instability and Homelessness
According to the 2022 Point-In-Time Count of persons experiencing homelessness, 33 percent of Marion County adults experiencing homelessness were age 50 and older. This represents a six point decrease in the share of homeless individuals that are age 50 or older. The number of people age 62 or older experiencing homelessness declined by 30 percent between 2021 and 2022, the largest drop in six years.26 Most homeless individuals (89 percent) are sheltered in emergency or transitional housing. Among older adults, the largest unsheltered population is in the 50-61 age group, where 47 individuals are unsheltered.
Recognizing multiple poverty- and health-related disparities is crucial to preventing homelessness and to housing older adults who currently experience homelessness. In both the United States and Indiana, disparities in homelessness exist across race and veteran status.27 For instance, older adult veterans are three times as likely to experience homelessness compared to older adult non-veterans.28 Additionally, Black veterans are disproportionately represented within the veteran population experiencing homelessness.29 Locally, Black adults are disproportionately likely to experience homelessness, comprising 56 percent of people experiencing homelessness in Marion County but fewer than 30 percent of its residents.
Veterans also make up a disproportionate number of people experiencing homelessness (167 individuals of any age, 12 percent of homeless population in 2022 compared to five percent of Marion County population in 2020), but the number of homeless veterans has been declining since 2017 (328 individuals, 18 percent of homeless population).30 To learn more about some of the systemic factors that lead to disparities in homelessness among older adult veterans, please read ‘Highlighting Equity’ on the following page.
Barriers to affordable Housing
Key informants interviewed for this report noted that older adults with criminal histories find it particularly difficult to find rental housing that will accept them. Specifically, the U.S. Fair Housing Act does not include formerly incarcerated people as a protected class, including those who have been arrested but not convicted.31 Landlords may perceive a criminal history as a risk to a rental community’s safety, which is a permitted form of discrimination. This is particularly problematic because not having an address makes it difficult for formerly incarcerated people to maintain consistent employment and income, and older adults with criminal histories tend to be disproportionately Black, Latinx, or have disabilities, adding to existing housing inequities. Nationally, transgender older adults also experience barriers to housing. According to the National Center for Transgender Equality, 19 percent of transgender older adults have been denied housing because of their gender identity and 11 percent have been evicted due to transgender discrimination.32
Lastly, older adult focus group participants across multiple income groups do not believe most assisted living communities are affordable, and do not anticipate being able to live in one. Most of these participants live in their own homes or in rental units. Key informants note that the inability to purchase a new home and relocate forces lower-income older adults to remain in their existing neighborhoods.


Homelessness among older adult veterans
In the United States, older adult veterans are three times as likely to experience homelessness compared to older adult non-veterans. Below are some systemic factors that can lead to high levels of homelessness among this population.
Individual Factors:
Race and ethnicity
Forty-three percent of U.S. veterans experiencing homelessness are people of color, although they only make up 18 percent of the general veteran population. This large proportion of veterans of color experiencing homelessness is likely due in part to structural inequities in housing and income that more acutely impact people of color.33
Higher prevalence of traumatic brain injuries (TBI), Post-Traumatic Stress Disorder (PTSD), and opioid use
Due to their military service, veterans have a higher risk of both TBIs and PTSD, which are considered some of the most substantial risk factors for homelessness. One study found that veterans with opioid use disorder are ten times more likely to be homeless as the general veteran population.34

Community Factors: Challenges with supporting the unique needs of older adult veterans
A report by the Government Accountability Office found that VA services are not often specifically targeted at older veterans experiencing homelessness. These individuals often have more complex health issues, such as ambulatory challenges or cognitive issues, which VA programs cannot fully address. For example, some older veterans experiencing homelessness may need care provided by assisted living services, but the VA does not cover veterans’ rent at these facilities, making this type of care unattainable for older veterans who may need it.35 36 37 38

Organizational Factors: Inadequate transitional training
In 1991, the U.S. military began the Transition Assistance Program (TAP), to assist service members with understanding U.S. Department of Veterans Affairs (VA) benefits and how their military-related skills could be transferred to civilian employment.39 However, a survey of U.S. veterans found that nearly half of respondents felt that the military did not prepare them well for transition to civilian life, on either a financial, emotional or professional level.40 Older adult veterans who left the military prior to TAP’s creation may have received less transitional support than those who did complete the program.

Policy Factors: Some veterans are barred from receiving VA benefits
Veterans who receive a punitive discharge from the military (such as a bad conduct or dishonorable discharge), are often ineligible for federal benefits through the VA, including compensation, pension, education or home loan benefits.41 Veterans not receiving a punitive discharge, but an ‘other than honorable’ discharge, may also be excluded from some benefits, such as the HUD-VASH program, which combines a HUD Housing Choice voucher with VA Medical Center case management.42 For example, a service member who tests positive on a drug test may receive an other-than-honorable discharge, meaning they may be barred from receiving the support and services they need once they leave the military. Overall, the refusal of benefits to certain veterans based on their discharge status can create significant barriers in obtaining proper housing, health care and employment necessary to prevent and end homelessness.43
Structural Racism Analysis
We measured structural racism in housing using three indictors: racial segregation, the ratio of home loan denial rates between Black and White borrowers, and the ratio of Black and White homeownership rates. In Indiana, the median county has a segregation index of 0.7, which is very segregated. (1.0 is the most extreme segregation possible.) Counties with large Black populations (Marion, Lake, Allen, St. Joseph, and Vanderburgh) have segregation values near the median. In the median county, Black borrowers are 21 percent more likely to be denied a loan than a White borrower. Again, the counties with the largest Black populations have values near the median. Finally, the homeownership rate is 3.4 times higher for White households compared to Black households in the median county. Counties with large Black populations tend to have worse outcomes in this measure, with White homeownership rates ranging from 3.1 to 5.4 times higher than Black hownership rates.
2-1-1 calls for housing assistance
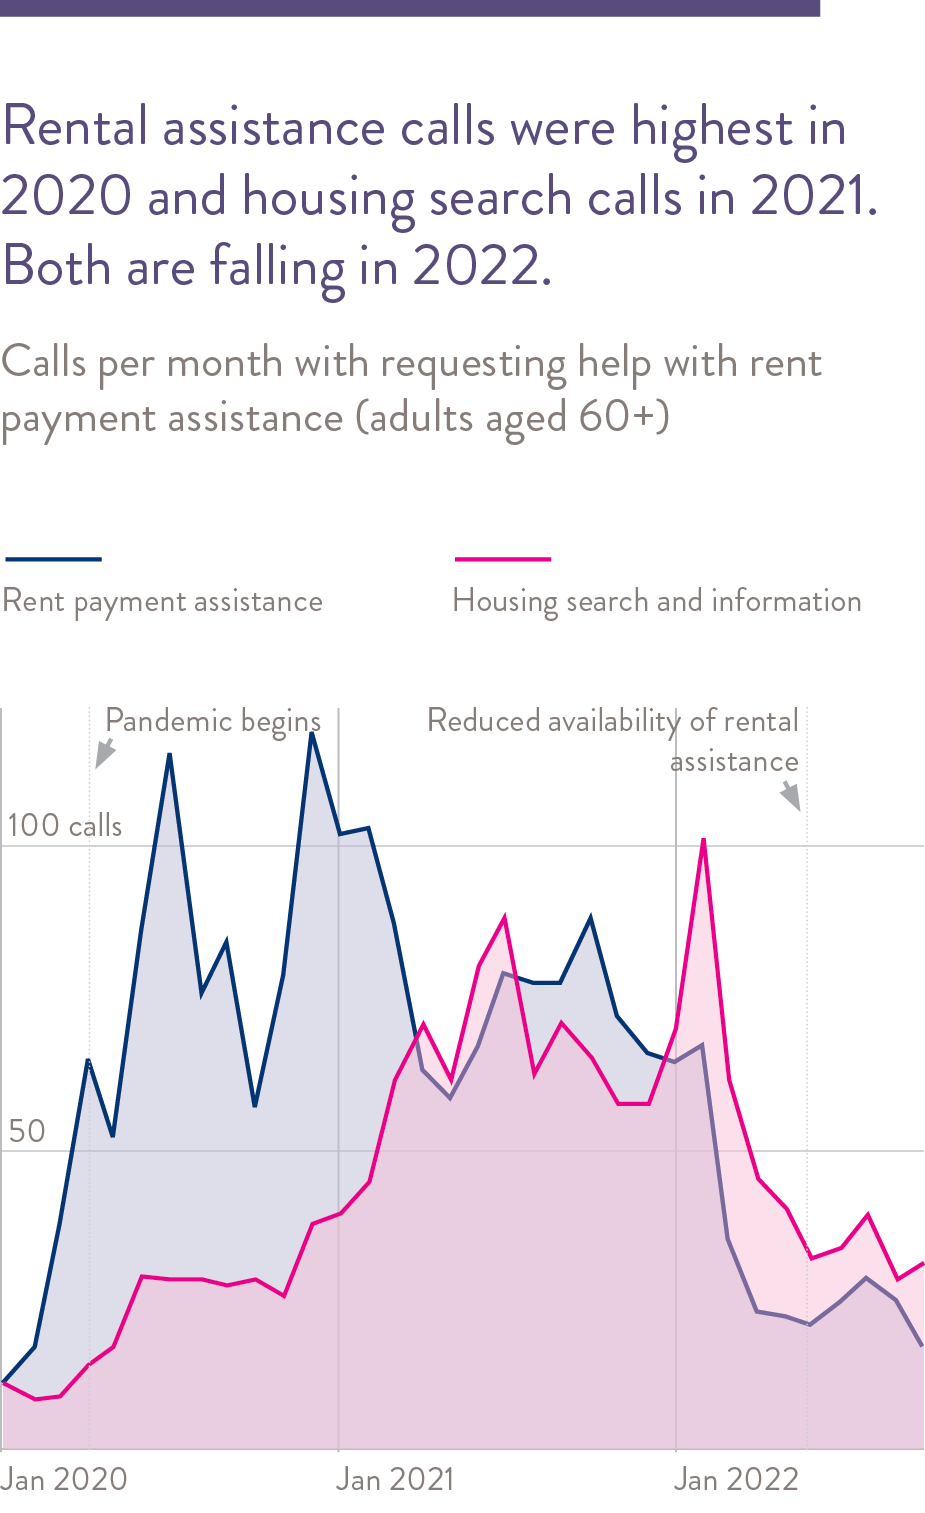
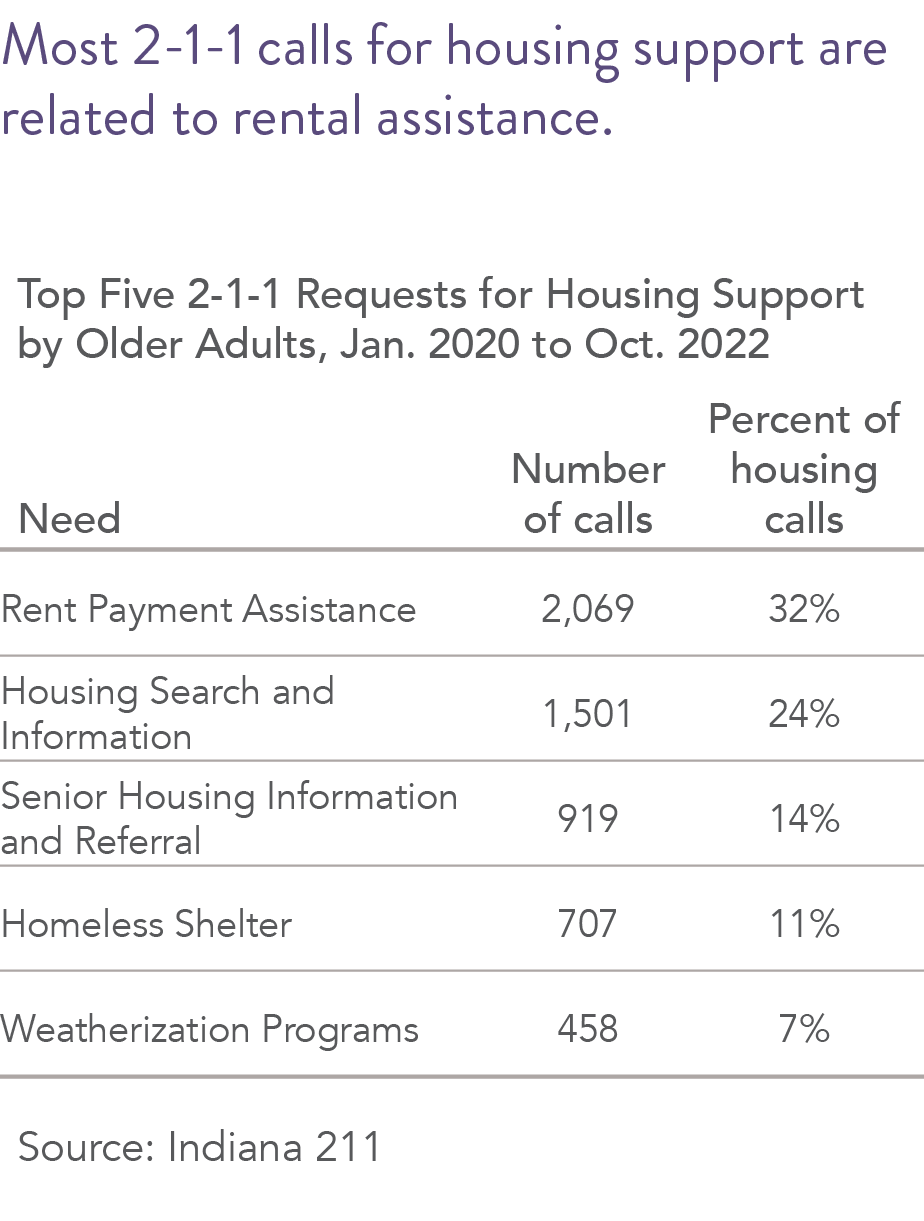
2-1-1 is a helpline service providing information and referral to health, human, and social service organizations. From January 2020 through October 2022, there have been 6,377 calls from people age 60 or older with at least one housing-related need.
One third of these calls involved need for rent payment assistance. This increased dramatically beginning in March 2020 as the pandemic caused job loss and reduced income. These calls fell steeply in 2022 possibly caused by a decline in the need for rental assistance or decreasing availability of rental assistance. (Beginning in summer 2022, assistance is only available in Marion County to those with an active eviction case.)
Calls related to housing search and information rose dramatically in 2021, which aligns roughly with the end of the local eviction moratorium. Indiana’s eviction moratorium ran from March to August 2020. The number of housing search calls has been falling in 2022.
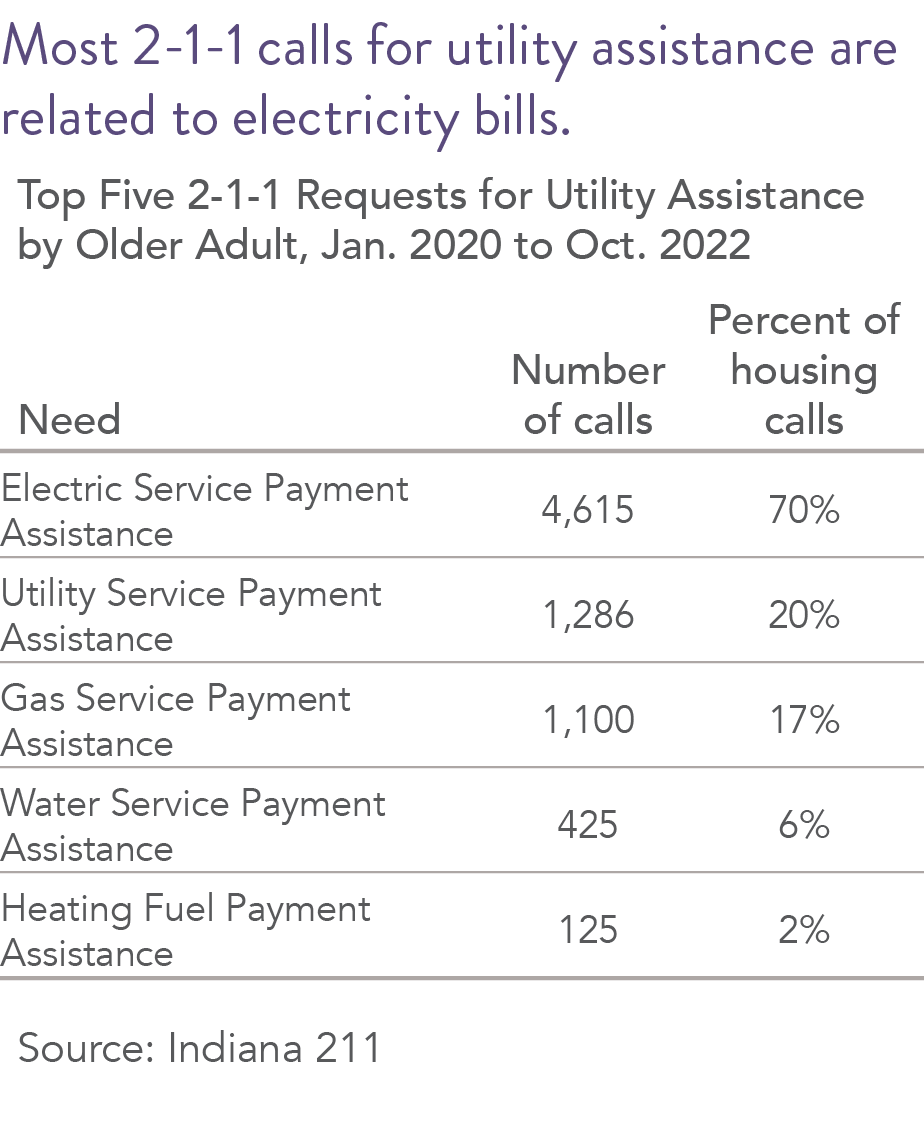
Among people age 60 and older, utilities are the most common need in 2-1-1 calls. There were 6,591 such calls between January 2020 and October 2022. The vast majority of these calls involved the need for electric service payment assistance. These calls have declined from 191 per month between March 2020 and February 2021 to 148 per month between March 2021 and February 2022. Since March 2022, there have only been 45 calls per month.
Among older adults, nearly all housing and utility calls come from Marion County residents.
2-1-1 calls from people age 60+, January 2020 through October 2022
- U.S. Department of Housing and Urban Deveopment, “Housing Cost Burden Among Housing Choice Voucher Participants | HUD USER.”
- An older adult household is defined as a household in which at least one older adult age 55 or older lives.
- PUMS data is released at the geographic level of PUMA (Public-Use Microdata Area). PUMAs must contain a minimum of 100,000 people and thus vary in geographic size. As a result, when using PUMS data, the Central Indiana region contains Putnam and Brown counties in addition to the eight Central Indiana Community Foundation counties of Boone, Hamilton, Hancock, Hendricks, Johnson, Marion, Morgan, and Shelby.
- U.S. Census Bureau, “2015-2019 American Community Survey Five-Year Public Use Microdata Samples [SAS Data File].”
- U.S. Census Bureau, “2016-2020 American Community Survey Five-Year Public Use Microdata Samples [SAS Data File].”
- U.S. Census Bureau, “2016-2020 American Community Survey Five-Year Public Use Microdata Samples [SAS Data File].”
- Harvard University Joint Center for Housing Studies, “The State of the Nation’s Housing 2020.”
- Kandris et. al, The Polis Center at IUPUI. “Health and Economic Impact of COVID-19 on Neighborhoods,” 2020. https://www.savi.org/feature_report/health-and-economic-impact-of-covid-19-on-neighborhoods/
- Indiana Housing and Community Development Authority, “Low-Income Home Energy Assistance Program Data.”
- LIHEAP data for 2018 are unavailable because of an information system change during that year.
- Indiana Housing and Community Development Authority, “Weatherization Program Data.”
- National Research Center, “CICOA Aging and In-Home Solutions Full Report,” 2013.
- National Research Center, “CICOA Aging and In-Home Solutions Full Report,” 2017
- Abt Associates and NYU Furman Center, “Federal Funding for Affordable Housing.”
- U.S. Department of Housing and Urban Development, “Multifamily Tax Subsidy Income Limits | HUD USER.”
- National Housing Preservation Database, “Data Sources.”
- U.S. Census Bureau, “2016-2020 American Community Survey Five-Year Estimates.”
- Because data about household income for adults age 62 and older is not readily available through the U.S. Census Bureau, we approximated the number of adult households age 62 and older with income at or below 50 percent of area median income using the number of older adults ages60 to 64 and those age 65 and older at or below this income level.
- U.S. Census Bureau.
- Thirty-five key informant interviews with caregivers and service providers were conducted during 2019 and 2020 to collect input on issues facing the older adult population in Central Indiana. Public and not-for-profit sector leaders and service providers who are knowledgeable about service systems and issues pertaining to older adults in Central Indiana were identified and interviewed as key informants during report preparation.
- Ailshire and García, “Unequal Places.”
- Nine focus groups with older adults were conducted during 2019 and 2020 to collect input on issues facing the older adult population in Central Indiana. The focus groups composed of older adults were assembled with the identification and recruitment assistance of community service providers. These focus groups were conducted by researchers, in person prior to the COVID-19 pandemic, and by Zoom after the pandemic began. The questions asked of the focus group participants were discussed and agreed upon by research faculty and staff.
- National Research Center, “CICOA Aging and In-Home Solutions Full Report,” 2021.
- U.S. Census Bureau, “2016-2020 American Community Survey Five-Year Public Use Microdata Samples [SAS Data File].”
- U.S. Census Bureau.
- Public Policy Institute Center for Research on Inclusion and Social Policy, “Homelessness in Indianapolis: 2020 Marion County Point-in-Time Count.”
- Public Policy Institute Center for Research on Inclusion and Social Policy.
- Pomerance, “Fighting on Too Many Fronts.”
- U.S. Department of Housing and Urban Development Office of Community Planning and Development, “2018 AHAR: Part 1 – PIT Estimates of Homelessness in the U.S.”
- Public Policy Institute Center for Research on Inclusion and Social Policy, “Homelessness in Indianapolis: 2020 Marion County Point-in-Time Count.”
- Fair Housing Center of Central Indiana, “Fair Housing and Criminal Background Screening.”
- Allison Auldridge et al., “Improving the Lives of Transgender Older Adults.”
- National Alliance to End Homelessness, “People of Color Make Up a Disproportionate Share of the Homeless Veteran Population.”
- National Alliance to End Homelessness, “Veteran Homelessness.”
- US Department of Veterans Affairs. “Assisted Living Facilities – Geriatrics and Extended Care.” Accessed January 21, 2021. https://www.va.gov/GERIATRICS/pages/Assisted_Living.asp.
- Pew Research Center, “Views of Post-9/11 Military Veterans.”
- U.S. Government Accountability Office, “Homeless Veterans: Opportunities Exist to Strengthen Interagency Collaboration and Performance Measurement Procedures.”
- “Assisted Living Facilities – Geriatrics and Extended Care.”
- Whitworth, Smet, and Anderson, “Reconceptualizing the U.S. Military’s Transition Assistance Program.”
- U.S. Government Accountability Office. 2020. “Homeless Veterans: Opportunities Exist to Strengthen Interagency Collaboration and Performance Measurement Procedures.” https://www.gao.gov/assets/710/706957.pdf.
- “Assisted Living Facilities – Geriatrics and Extended Care.”
- National Alliance to End Homelessness, “Expanding Eligibility for HUD-VASH to Other-Than-Honorably Discharged Veterans (H.R. 2398 and S. 2061).”
- USC Suzanne Dworak-Peck School of Social Work, “Why Do Veterans Become Homeless?”
