Health Outcomes 2022
Mortality rates, rates of disease, notable changes, and disparities in the health of Central Indiana older populations.
-
COVID-19 was the third leading cause of death in Central Indiana in 2020. The pandemic led to increased mortality, contributed to excess deaths from other diseases, and increased the inequity between Black and White death rates.
- Cancer remains the leading cause of death for the younger- and middle-old. Heart disease is the leading cause of death for the oldest-old.
- Alzheimer’s disease is the fourth leading cause of death among those age 85 and older. COVID-19 is the second leading cause of death for this group.
- Ambulatory disability is the leading type of disability for older adults in Central Indiana.
- Deaths from falls, drug overdose, and suicide have increased in older adults in Central Indiana over time, matching state and national trends. Older men are disproportionately affected by deaths from falls and suicide compared to women. Blacks older adults are disproportionately affected by deaths from drug overdose compared to White older adults.
Mortality increased dramatically in 2020 as a result of COVID-19.
Age-adjusted mortality rates, age 55+ per 100,000
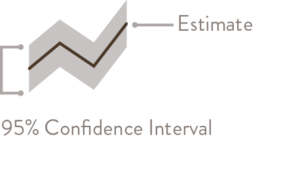
How to read this chart. These statistics are only estimates. The estimate itself is shown as a dark line. The shaded area around that line represents the confidence interval. We are 95% sure the true value lies in that shaded area.
Mortality
The COVID-19 pandemic caused extensive death and drove mortality rates to levels not seen in 20 years. Mortality rates for Indiana and Central Indiana have long been higher than the national average, and in 2020 mortality rose faster in Central Indiana as well. The region’s mortality rate increased 19 perent, compared to a 16 percent increase in the U.S.1
Black older adults in Central Indiana have the highest mortality rates in each age group, with the exception of the oldest-old (age 85 and older), where White older adults have the highest mortality rates. Latinx older adults have the lowest mortality rates across all age groups.2 The racial/ethnic disparities seen in Central Indiana mirror those in the state and nation.3 The pandemic caused mortality rates to rise faster for Black individuals than for White individuals in every older-adult age group. As a result, the Black-White gap in mortality rates is larger than in 2019. Mortality increased dramatically in 2020 as a result of COVID-19.
Causes of Death
Nationally, the top seven causes of death in the age 55 and older population are cancer, heart disease, COVID-19 chronic lower respiratory diseases, Alzheimer’s disease, cerebrovascular diseases, diabetes, and accidents.4 The order of prominence of the top causes of death varies across age groups. For example, cancer is the primary cause of death for the younger-old, whereas heart disease and COVID-19 are the primary causes of death in the oldest-old.5 Similarly, Alzheimer’s disease is the fifteenth leading cause of death for the younger-old, but the fourth leading cause of death for the oldest-old.
In Central Indiana, the rates for the top causes of death are relatively consistent with national averages according to age-adjusted rates from the Centers of Disease Control and Prevention (CDC). Rates of death from accidents steadily increased among the younger-old in the last decade. However, there are some causes of death for which the region has a higher mortality rate than the nation. Mortality from cancer is the leading cause of death for those under age 75, and although Central Indiana rates have steadily declined since 1999, they are an estimated seven percent higher than the U.S cancer mortality rate. Central Indiana and Indiana compared to national rates. Similarly, deaths from chronic respiratory disease for those under age 75 are higher. Central Indiana’s mortality rates are also elevated for COVID-19 (14 percent higher than U.S.), chronic lower respiratory diseases (36 percent higher), and accidents (18 percent higher).
COVID-19 Morality for Older Adults
While Central Indiana mortality rates from cancer and heart disease are similar for Black and White older adults, the age-adjusted COVID-19 mortality rates are over 50 percent higher for Black and Latinx older adults than for White older adults (700, 780, and 460 deaths per 100,000 population, respectively.) Nationally, this racial disparity is even greater, with Black and Latinx older adults having double and triple the COVID-19 death rates of White older adults. However, Central Indiana’s smaller racial disparity appears to be driven by White older adults in Central Indiana having higher COVID-19 death rates than the U.S. versus people of color in Central Indiana having lower COVID-19 death rates that the U.S. More specifically, the COVID-19 mortality rate for White older adults is 57 percent higher in Central Indiana than in the U.S., while the rates for Black and Latinx individuals are respectively 10 percent and 35 percent over the national average.
The actual impact of COVID-19 on mortality is higher than just those deaths where COVID-19 is listed as the underlying cause of death. Epidemiologists usually measure excess deaths to assess the overall impact of a pandemic. Excess deaths are the difference between the actual number of deaths and the expected number of deaths in a specific period. These estimates can give information about the burden of mortality potentially related to the COVID-19 pandemic, including deaths that are directly or indirectly attributed to COVID-19. In Indiana, from the week beginning on March 14, 2020 (the week in which the first COVID-19 death was reported in Indiana) to February 19, 2022 (the most recent complete data), there were 158,292 deaths. Based on previous trends, the expected number of deaths during that time was 135,148. Therefore, excess deaths for people of all ages total 23,144.6
Some of these deaths are directly attributable to COVID-19, but deaths due to other causes were also higher than average. Compared to the expected deaths, 1,285 more Hoosiers died of Alzheimer’s disease since February 1, 2020. Similar trends were seen nationally. An analysis of Medicare enrollees showed that excess mortality was twice as high for older adults with dementia in the early phase of the COVID-19 pandemic than for those without dementia.7
Higher than average deaths were also observed for hypertensive diseases, with 1,596 more deaths than the average. Deaths due to other causes like diabetes and cerebrovascular disease also saw higher numbers than average.8
Multiple factors may have contributed to the increase of diseases beyond COVID-19 throughout the pandemic. According to the World Health Organization, excess mortality during the pandemic can be attributed to a disruption in health care services such as lack of access, reduced doctor visits for primary care, disruption in treatments, and travel disruptions.9
The pandemic has caused significant harm, and additional research is needed to fully understand the reasons behind excess mortality and find steps to reduce it.
The indirect effects of COVID-19, including increased adoption of telehealth, decreased access to community resources, and increased social isolation, may also impact health outcomes. These effects disproportionately affect older adults with dementia who have often have sparse social networks and increased dependence on health systems.
Disability
According to the CDC, disability is defined as any condition (impairment) of the body and mind that makes it more difficult for a person to do certain activities and interact with the world around them.10 The types of disabilities include vision, movement, thinking, remembering, learning, communicating, hearing, mental health, and social relationships.11 The prevalence of disabilities in the older adult population provides a measure of the impact of chronic conditions on quality of life, including whether living a longer life necessarily translates into living an active and independent life.12
In 2020, 25 percent of those age 65 to 74 had a disability, compared with 49 percent for those age 75 or older.13 Ambulatory disability is the most common type of disability in the older adult population in Central Indiana, followed by hearing disability. Disability rates fell by two percentage points for both age groups between 2015 to 2020.
Disability can be conceived as a gap between individuals’ capacities (physical, cognitive, and sensory ability) and their performance in daily activities and participation in social life. These physical and social barriers result in loss or limitation of opportunities to participate on an equal level in normal community life.14 This functional disability in older adults is routinely measured by their ability to perform activities of daily living (ADL).15 16
According to the 2022 Community Assessment Survey for Older Adults®, many Central Indiana adults age 60 and older report that maintaining their homes (56 percent, up from 45 percent since 2017) or yards (43 percent, down from 49 percent in 2017) is at least a minor problem.17 Activities of daily living are also a challenge for some. Nearly two-thirds (65 percent) of older adults report that doing heavy or intense housework is at least a minor problem.

Racial and ethnic disparities persist across most age groups.
Central Indiana mortality rates (per 100,00) by age and race, 2019 and 2020

Increased mortality in 2020 was driven by COVID-19, increases in Alzheimers and diabetes, and a halt in the decline of cancer and heart disease.
Central Indiana mortality rates per 100,000 by cause of death
Notable Health Changes in Central Indiana
The health needs of older adults are different than those of younger age groups. Common chronic conditions affecting older adults are often accompanied by functional disability, making it more difficult to participate in typical daily activities and interactions and potentially reducing their quality of life. Despite some improvement in self-management of symptoms, treatments and lifestyle choices, the rates of some chronic diseases still are trending in the wrong direction.
Depression
Clinical depression is a common and serious mood disorder. It causes severe symptoms that affect how one feels, thinks, and approaches daily activities, such as sleeping, eating, or working. Statewide, rates of depression for Hoosiers age 55 and older were stable from 2011 to 2020. Adults age 55 to 64 were more likely to be depressed (22 percent) than those age 65 and older (16 percent).18 The rates are higher for women than men (28 percent and 16 percent respectively). The rates are higher for women as compared to men (29 percent and 15 percent respectively 2019).19
These numbers likely underrepresent the magnitude of clinical depression among the older adult population due to underreporting. According to the CASOA survey, 43 percent of older adults say feeling depressed is at least a minor problem, 39 percent say feeling lonely is a problem, and 44 percent say feeling bored is a problem. Accurate diagnosis of depression in older adults is important because undiagnosed or misdiagnosed depression can eventually culminate in other mental health and social problems, such as decreased cognitive and social functioning and increased suicide rates. Although women are more likely to be diagnosed with depression,20 men are more likely to commit suicide and are less likely to seek mental health help as compared to women21 and are less likely to be appropriately diagnosed.22 Men over age 55 commit suicide at five to six times the rate of women. Since 1999, national and statewide suicide rates have been increasing for both men and women, although the rate of increase for women is lower.23
When depression and depressive symptoms are diagnosed, many antidepressant medications are safe and well tolerated in older populations24 and considered the first line of treatment.25 Older individuals also benefit from receiving therapy from a mental health professional (psychiatrist, psychologist, or counselor) as an effective method of treating depression.26 However, a growing body of evidence suggests undertreatment of depressive disorders in the older population is widespread.27 Treatment approaches that actively elicit and consider the preferences of the older adult may help to address this.28 While screening, diagnosis, and treatment of depression is critical, the treatment in the older adult populations comes with its own risks. Polypharmacy, the prescription of multiple drugs to an individual, can lead to increased risk of adverse drug events, drug-interactions, medication non-adherence and reduced functional capacity.
Suicide rates are rising among older men.
Suicide rates per 100,000,
age 55+ by gender
Are there differences by gender? Compare the four female data points and the four male data points.
Are rates changing over time? Within each gender group, each row is a five year time span. Move down the rows to move forward in time.
Are changes large enough to be statistically meaningful? The pale dots represent the range of our estimate. Changes in female rates are probably not statistically meaningful because the estimate ranges overlap. For male rates, the change between 2009 and 2014 is probably statistically meaningful.
Alzheimer’s Disease
“Alzheimer’s disease is an irreversible, progressive brain disorder that slowly destroys memory and thinking skills, and, eventually, the ability to carry out the simplest tasks.”29 It is the most common cause of dementia30 among older adults, but it is not a normal part of aging.31
The prevalence of Alzheimer’s disease in the U.S. is increasing. An estimated 5.8 million Americans age 65 and older are living with Alzheimer’s disease. By 2050, the number of Americans age 65 and older with Alzheimer’s dementia is projected to reach 13.8 million, increasing 137 percent from 2020. While death due to other chronic conditions that impact the older adult population has either decreased or remained steady, death due to Alzheimer’s disease has increased. It was the fifth leading cause of death in Central Indiana in 2020.32
Drug Overdose Deaths
For those age 55 and older in the U.S., drug overdose deaths increased more than six-fold between 1999 and 2020. These deaths increased by 19 percent between 2019 and 2020.
Racial and ethnic disparities in drug overdose deaths persist.33 Nationally, disparities worsened between 2019 and 2020, when the overdose death rate rose 30% for Black older adults and 17 percent for White older adults. This is also reflected locally, where the drug overdose death rate is more than twice as high for Black older adults as for White. To learn more about factors that influence higher rates of opioid-related deaths among Black older adults, please read ‘Highlighting Equity’ below.
Opioid Use Disorder
Opioid use disorder (OUD) is defined as a problematic pattern of opioid use that leads to serious impairment or distress. The use of prescription opioids is considerably higher in older age groups due to multiple chronic conditions leading to chronic pain. As such, this age group is at a higher risk of developing OUD due to availability of prescription opioids and increased vulnerability resulting from overall health conditions.
In Central Indiana, opioid overdose has resulted in increasing death rates in age 55 and older across all races from 2010 to 2020. Between 2010 and 2015, the average opioid overdose death rate was 2.7 per 100,000 older adults. Between 2016 and 2020, that rate had climbed to an average of 10.5 per 100,000 older adults. Death rates are consistently higher for Black older adults than White older adults. These racial disparities were also observed statewide.
Alzheimer’s death rates are increasing quickly among those 85 or older.
Alzheimer’s deaths among those age 85+ per 100,000
Drug overdose deaths among older adults are increasing dramatically, especially among black individuals.

Black opioid death rates higher than White rates
Between 2015 and 2020, opioid overdose deaths fell slightly for White Hoosiers, but nearly doubled for Black Hoosiers.34 Below are some factors that have influenced this increase in opioid use and death rates among this population:

Interpersonal factors: Fear of legal consequences
The “War on Drugs” movement that began in the 1980s created severe penalties for nonviolent drug offenses, which resulted in disproportionate rates of incarceration for people of color in comparison to White Americans. This, as well as other numerous historical events, have sown mistrust within Black communities toward the healthcare and criminal justice systems and created fear that seeking treatment for opioid use will result in arrest or incarceration.35

Community factors: Less access to prescribed opioids
Studies have shown that Black older adults who experience chronic pain may be untreated or under-treated for their pain,36 and are significantly less likely to be prescribed opioid medications for pain than White patients. This disparity may be attributed to underestimating Black patients’ self-reported pain, as well as stereotyping and discrimination by providers.37 Although this lack of access to prescription opioids created somewhat of a protective effect for Black patients against prescription-opioid misuse, it also led to an increase in people of color accessing illegal versions of these drugs, which are often laced with synthetic opioids such as fentanyl.38 An analysis of opioid deaths in large metro areas found that 70% of opioid-related deaths among middle-age Black adults were tied to synthetic opioids, compared to only 54% of White and 56% of Latinx opioid-related deaths. Between 2014 and 2017, synthetic opioid-related deaths rates increased by over 800% among Blacks, the sharpest increase among all races and ethnicities.39

Policy factors: Disparities in access to treatment
Black people with opioid use disorder often have less access than White people to the full range of medication-assisted treatment options available. While both buprenorphine and methadone are effective treatments, buprenorphine is often considered a less stigmatizing and disruptive option. Methadone treatments require daily visits to methadone clinics, mandatory counseling and regular and random drug testing. In contrast, buprenorphine is an office-based treatment that can be administered by a primary care physician. However, studies have shown that methadone clinics are most common in low-income areas with greater proportions of people of color, while buprenorphine treatment is most accessible in residential areas with more White, higher-income patients.40 Buprenorphine treatments are most often paid for either out-of-pocket (40 percent) or by private insurance (34 percent), while Medicare and Medicaid only accounted for 19 percent of visits.41 Although most Medicare Part D plans included buprenorphine treatments, as of 2018, 65 percent of these plans have some sort of restricted coverage for this medication.42 This further creates disparities in access for Black older adults who rely on Medicare for health coverage. Even though both Black and White patients experience similar rates of opioid use disorder, White patients were 35 times more likely to receive a buprenorphine prescription than Black patients.43
Falls
Falls are the leading cause for fatal and non-fatal injuries for older Americans.44 According to the 2022 Community Assessment Survey for Older Adults™ (CASOA) survey results, 32 percent of older adults in Central Indiana reported falling or injuring themselves in their own homes, highlighting the need for fall prevention programs featuring risk factor interventions. An increasing share of older adults across Indiana report that falls are a problem (36 percent in 2021 compared to 28 percent in 2013). Central Indiana did not experience a similar increase. However, fatalities from falls increased significantly between the 2011 to 2015 and the 2016 to 2020 time periods. The average mortality rate from falls increased by 47 percent between those periods in Central Indiana and 18 percent statewide. Mortality rates are higher for men than for women (33.5 percent compared to 20.4 percent) and are increasing faster for men as well (53 percent increase compared to 36 percent). See the Aging in Place chapter for more detail about adults who choose to age at home.
Obesity
Obesity is a complex health condition with several causes and contributing factors. These include behavioral factors like eating habits, inactivity, medication use, and other environmental exposures (social media, pollution, chemicals, etc.) In 2020, 20 percent of Central Indiana’s Medicare and Medicaid beneficiaries age 65 and older were obese, compared to nine percent in 2013. This is similar to statewide rates, which were 18 percent and nine percent in 2020 and 2013, respectively.
Diabetes
Diabetes is a chronic condition that requires careful management and continuous support to avoid complications such as heart disease, eye and vision problems, kidney disease and nerve damage. Although the burden of diabetes is often described in terms of its impact on working-age adults, diabetes in older adults is linked to higher mortality, reduced functional status and increased risk of institutionalization.45 In Central Indiana, diabetes rates in older adults remained stable from 2013 to 2020 among CMS beneficiaries, though rates for people of color have been persistently higher. The death rate from diabetes rose 28 percent in Central Indiana between 2019 and 2020, a statistically significant increase. This was the first significant increase since 2014 to 2015.
Socio-Economic and Lifestyle Risk Factors
It is important to note that socioeconomic and lifestyle factors both have a large influence on chronic disease and disability trends. Risk factors include smoking, obesity, diabetes, hypertension, and mental health conditions (e.g., depression, Alzheimer’s disease, and anxiety). Socioeconomic factors, such as employment rate, available jobs, increasing earning inequities and older full retirement age contribute to the fluctuation in reported disability and chronic disease incidence rates.
- The data for mortality trends is obtained from CDC WONDER.
- Rates for Latinx are considerably lower, under-reporting of ethnicity on the death certificate is a factor that should be considered while interpreting these data.
- CDC Wonder data allows for separation of non-Latinx Black and non-Latinx Whites. The data for Latinx in this report includes Latinx Whites as data for Latinx Blacks for all categories was suppressed or unreliable.
- The leading cause of deaths for ten-year age groups are obtained from CDC WONDER data using the ICD-10 cause list.
- SoAR age groups
- “Excess Deaths Associated with COVID-19.” (2022, April 20). https://www.cdc.gov/nchs/nvss/vsrr/covid19/excess_deaths.htm
- Excess Deaths Twice as High for Dementia Patients During Pandemic. (2022, February 28). https://www.medpagetoday.com/neurology/dementia/97406
- “Excess Deaths Associated with COVID-19.”
- “Essential health services face continued disruption during COVID-19 pandemic.” (n.d.). Retrieved April 22, 2022, from https://www.who.int/news/item/07-02-2022-essential-health-services-face-continued-disruption-during-covid-19-pandemic
- CDC, “Disability and Health Overview | CDC,” Centers for Disease Control and Prevention, September 15, 2020, https://www.cdc.gov/ncbddd/disabilityandhealth/disability.html.
- CDC
- In 1980, Dr. James Fries, Professor of Medicine, Stanford University introduced the compression of morbidity theory. This theory states that “most illness was chronic and occurred in later life and postulated that the lifetime burden of illness could be reduced if the onset of chronic illness could be postponed and if this postponement could be greater than increases in life expectancy’.” Stanford School of Medicine. Compression of Morbidity Theory. https://palliative.stanford.edu/overview-of-palliative-care/compression-of-morbidity-theory/
- American Community Survey, 2016-2020 Five-Year Average
- Dan Goodley, Disability Studies : An Interdisciplinary Introduction / (Los Angeles, Calif ; SAGE, 2011).
- The activities of daily living (ADLs) is a term used to collectively describe fundamental skills that are required to independently care for oneself such as eating, bathing, and mobility
- Instrumental activities of daily living (IADL) are those activities that allow an individual to live independently in a community. The major domains of IADLs include cooking, cleaning, transportation, laundry, and managing finances.
- Community Assessment Survey for Older Adults TM, “Cc” (National Research Center Inc., 2021), https://cicoa.org/news-events/research/.
- “CDC – BRFSS,” August 31, 2020, https://www.cdc.gov/brfss/index.html.
- “CDC – BRFSS.”
- J. Angst et al., “Gender Differences in Depression,” European Archives of Psychiatry and Clinical Neuroscience 252, no. 5 (October 1, 2002): 201–9, https://doi.org/10.1007/s00406-002-0381-6.
- “Adequacy of Antidepressant Treatment After Discharge and the Occurrence of Suicidal Acts in Major Depression: A Prospective Study | American Journal of Psychiatry,” accessed February 3, 2021, https://ajp.psychiatryonline.org/doi/10.1176/appi.ajp.159.10.1746?url_ver=Z39.88-2003&rfr_id=ori%3Arid%3Acrossref.org&rfr_dat=cr_pub++0pubmed&.
- “Men, Masculinity, and the Contexts of Help Seeking. – PsycNET,” accessed February 3, 2021, https://content.apa.org/record/2003-02034-001.
- Changes in suicide rates for Central Indiana are within the margin of error (CDC WONDER)
- Muhammad M. Mamdani et al., “Use of Antidepressants Among Elderly Subjects: Trends and Contributing Factors,” American Journal of Psychiatry 157, no. 3 (March 1, 2000): 360–67, https://doi.org/10.1176/appi.ajp.157.3.360.
- George S. Alexopoulos et al., “Pharmacotherapy of Depression in Older Patients: A Summary of the Expert Consensus Guidelines,” Journal of Psychiatric Practice® 7, no. 6 (November 2001): 361–76.
- Pim Cuijpers, Annemieke van Straten, and Filip Smit, “Psychological Treatment of Late-Life Depression: A Meta-Analysis of Randomized Controlled Trials,” International Journal of Geriatric Psychiatry 21, no. 12 (2006): 1139–49, https://doi.org/10.1002/gps.1620.
- Lisa C. Barry et al., “Under-Treatment of Depression in Older Persons,” Journal of Affective Disorders 136, no. 3 (February 2012): 789–96, https://doi.org/10.1016/j.jad.2011.09.038.
- “The Treatment of Depression in Older Adults: Practitioner’s Guide for Working with Older Adults with Depression,” The Treatment, n.d., 36.
- “Alzheimer’s Disease and Related Dementias,” National Institute on Aging, accessed January 22, 2021, http://www.nia.nih.gov/health/alzheimers.
- “What Is Dementia? Symptoms, Types, and Diagnosis,” National Institute on Aging, accessed February 5, 2021, http://www.nia.nih.gov/health/what-dementia-symptoms-types-and-diagnosis.
- Peter T. Nelson et al., “Alzheimer’s Disease Is Not ‘Brain Aging’: Neuropathological, Genetic, and Epidemiological Human Studies,” Acta Neuropathologica 121, no. 5 (May 2011): 571–87, https://doi.org/10.1007/s00401-011-0826-y.
- “New Alzheimer’s Association Report Shows Significant Disconnect Between Seniors, Physicians When,” Alzheimer’s Disease and Dementia, accessed January 25, 2021, https://alz.org/news/2019/new-alzheimer-s-association-report-shows-signifi.
- “Overdose Death Maps | Drug Overdose | CDC Injury Center,” November 20, 2020, https://www.cdc.gov/drugoverdose/data/prescribing/overdose-death-maps.html.
- CDC Wonder.
- “The Opioid Crisis and the Black/African American Population: An Urgent Issue.”
- Mohsen Bazargan et al., “Psychotropic and Opioid-Based Medication Use among Economically Disadvantaged African-American Older Adults,” Pharmacy 8, no. 2 (April 27, 2020): 74, https://doi.org/10.3390/pharmacy8020074.
- “The Opioid Crisis and the Black/African American Population: An Urgent Issue.”
- Jasmine Drake et al., “Exploring the Impact of the Opioid Epidemic in Black and Latinx Communities in the United States,” Drug Science, Policy and Law 6 (January 1, 2020): 2050324520940428, https://doi.org/10.1177/2050324520940428.
- “The Opioid Crisis and the Black/African American Population: An Urgent Issue.”
- “The Opioid Crisis and the Black/African American Population: An Urgent Issue.”
- “Stark Racial, Financial Divides Found in Opioid Addiction Treatment,” University of Michigan, accessed January 22, 2021, https://labblog.uofmhealth.org/industry-dx/stark-racial-financial-divides-found-opioid-addiction-treatment.
- Daniel M. Hartung et al., “Buprenorphine Coverage in the Medicare Part D Program for 2007 to 2018,” JAMA 321, no. 6 (February 12, 2019): 607, https://doi.org/10.1001/jama.2018.20391.
- “Black Patients Less Likely to Get Treatment for Opioid-Use Disorder,” American Medical Association, accessed January 22, 2021, https://www.ama-assn.org/delivering-care/opioids/black-patients-less-likely-get-treatment-opioid-use-disorder.
- “Fall Prevention – Programs and Tips for Older Adults & Caregivers,” NCOA, accessed January 25, 2021, https://www.ncoa.org/healthy-aging/falls-prevention/.
- “National Diabetes Statistics Report 2020. Estimates of Diabetes and Its Burden in the United States.,” 2020, 32.