Demographics
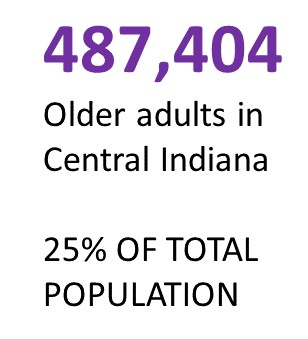
A growing population of nearly half a million adults age 55 and older lives in Central Indiana. This older adult population is not a monolithic group but varies by age group, race, ethnicity and household composition, socioeconomic status, and other characteristics. This section of the report presents key population trends and demographics highlighting the diverse nature of older adults in Central Indiana. Key findings include:
- This 2023 chapter update shows long-term trends continue. Between 2020 and 2021, the older adult population increased by 11,589 and became slightly more diverse. Older adults of color increased by 4,400 and now make up 18 percent of the older adult population.
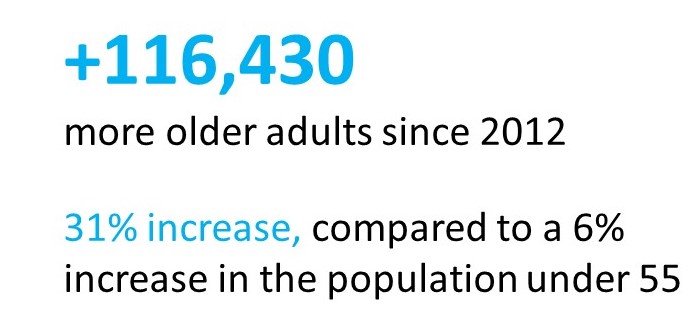
- The older adult population is increasing at over four times the rate of the younger population.
- People of color comprise one in six older adults. The older adult population will become increasingly diverse as the more heterogeneous younger population ages.
- More than one-third of older adults live alone.
- Older adults of color are almost three times more likely to experience poverty compared to White older adults.
Current Population Estimates (2021)
Population Trends
Race and Ethnicity
Households and Families

Income and Poverty
Location of older adults in Central Indiana
Demographics
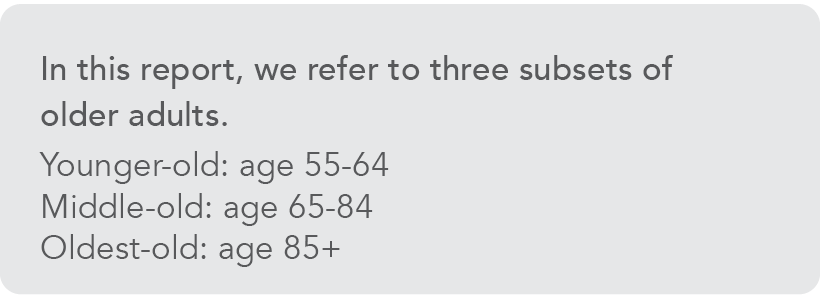
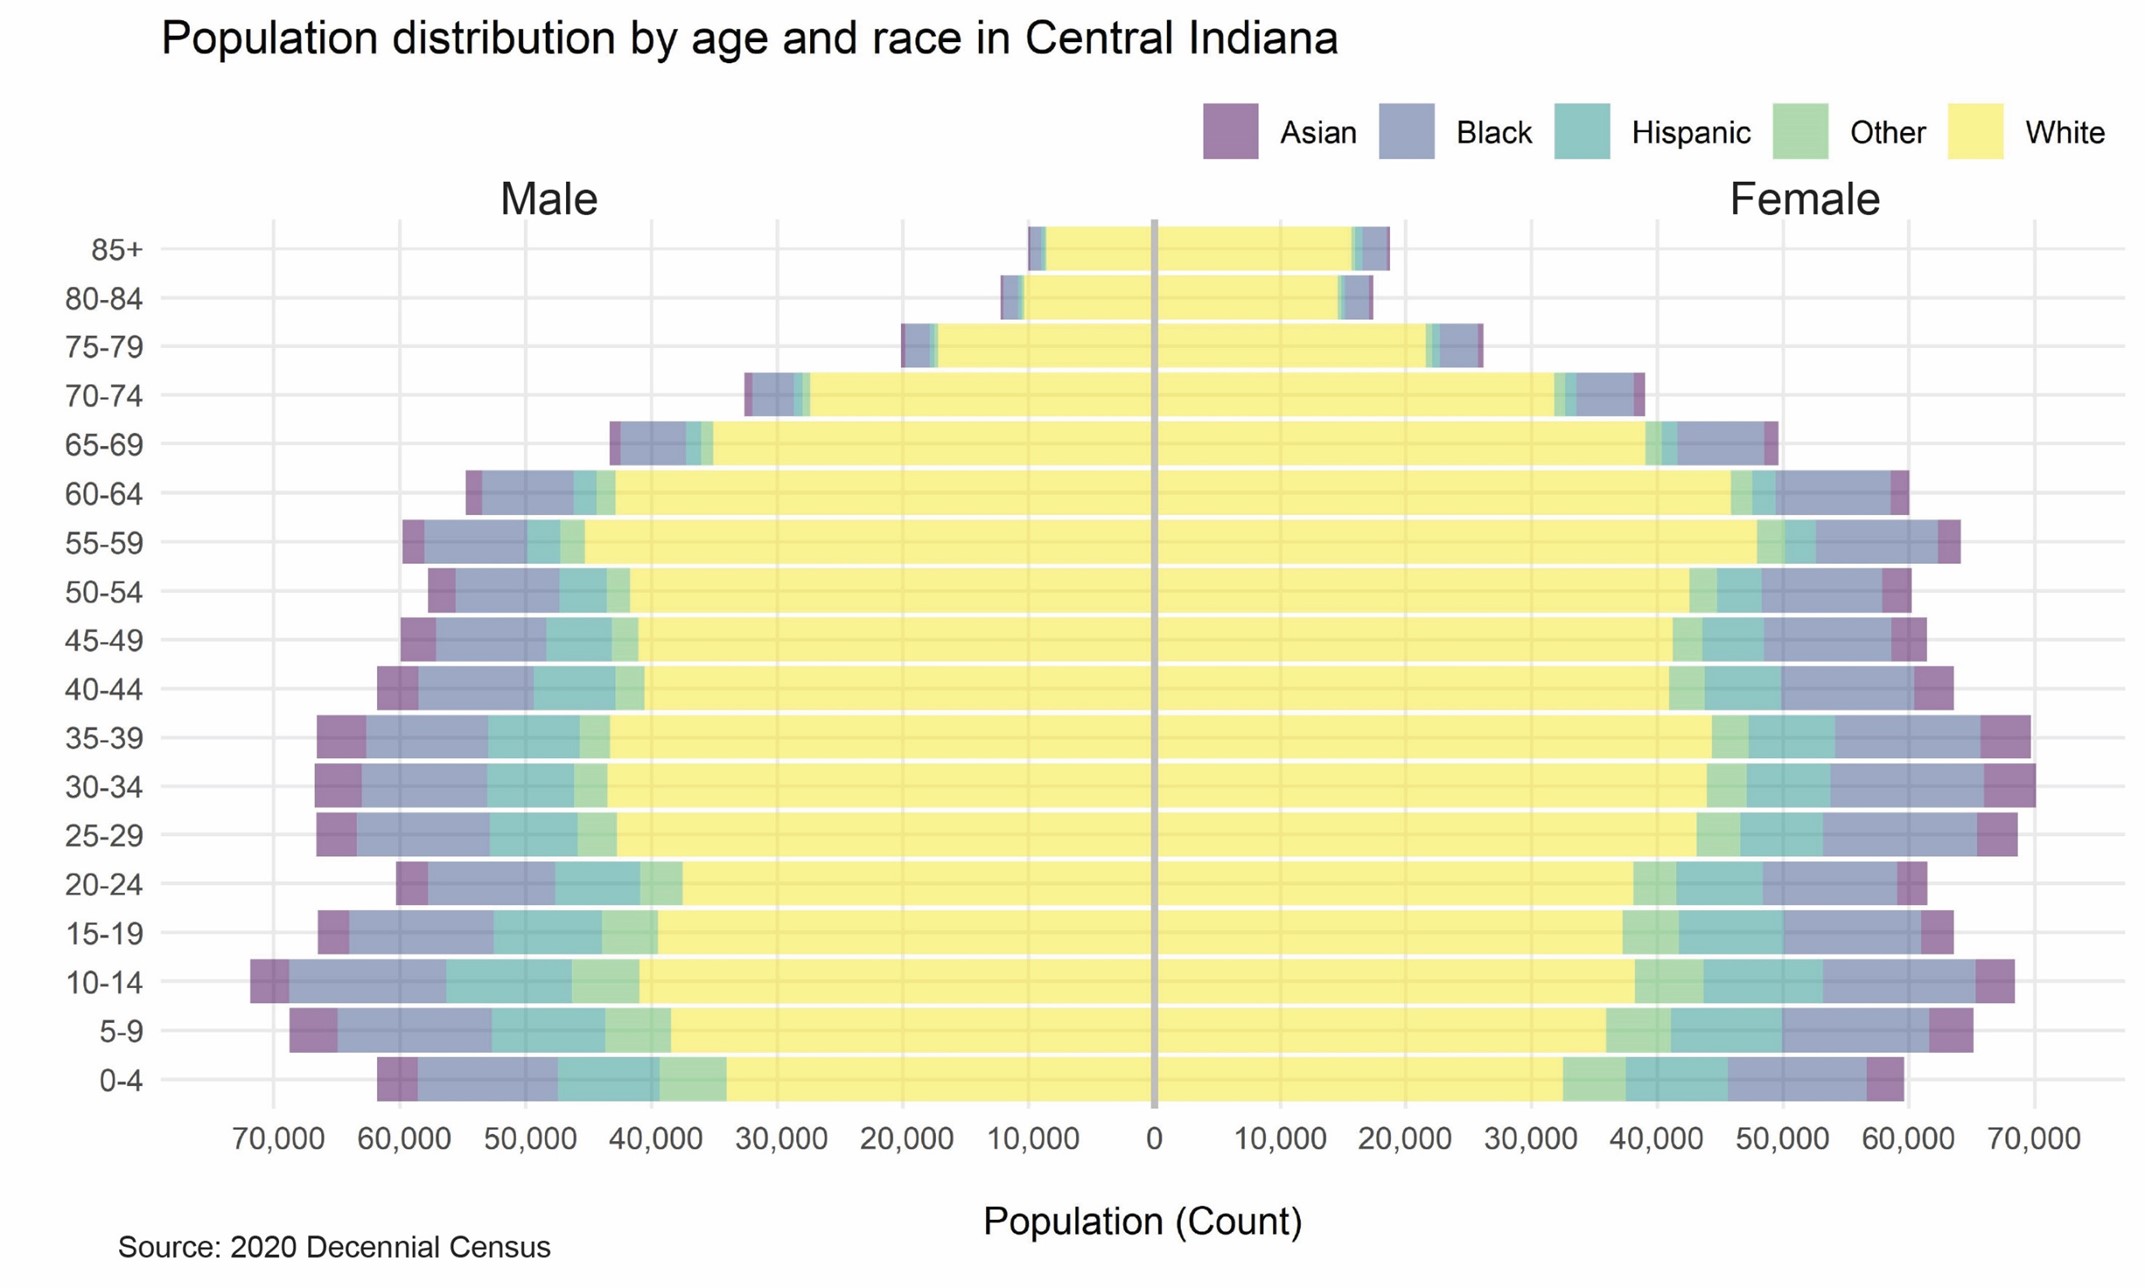
As the Baby Boomer’s age, the older adult population in Central Indiana increased by 31 percent between 2012 and 2021. In contrast, the population under age 55 increased by six percent. Population increases were significant for all age groups. As of 2021, older adults were one-quarter (25 percent) of the Central Indiana population, which is slightly lower than for the state (29 percent). The oldest-old age group, those aged 85 and older, is 1.5 percent of the population in Central Indiana. The younger-old (55 to 64 years) are 12 percent of the total population and the middle-old (65 to 84 years) age group make up 12 percent of the population.
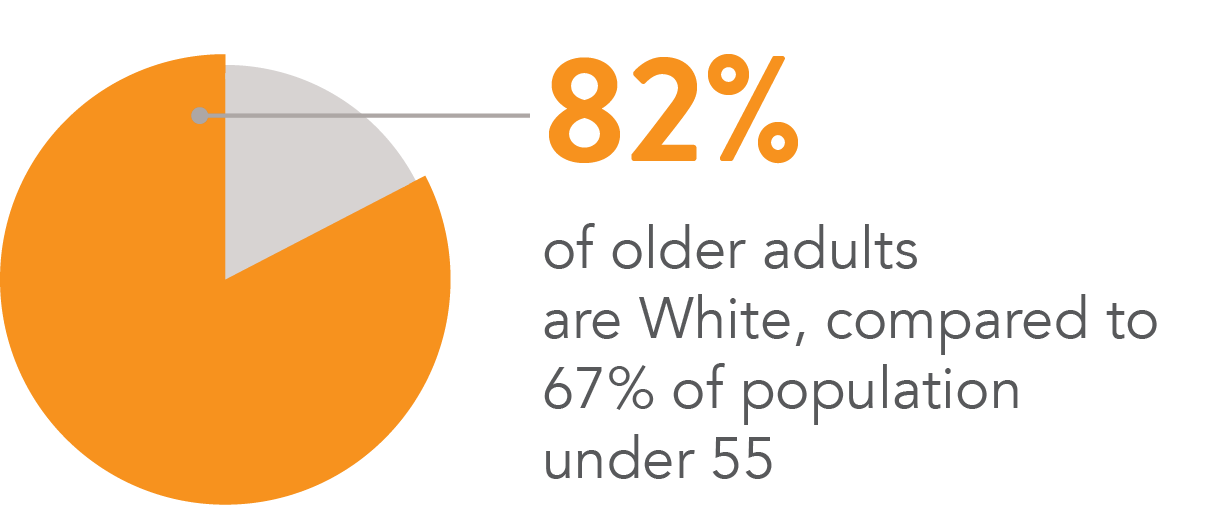
While older adults in Central Indiana are more diverse than the rest of the state, the majority (82 percent) aged 55 and older in Central Indiana are White. The older adult population is less diverse than subsequent generations. One-third of those under age 55 (33 percent) are people of color. The racial makeup of older adults will change as this younger, more diverse cohort grows older.
Older Adult Households
Age, race, and ethnicity relate strongly to the kinds of households and families in which older adults live. As householders age, they are more likely to become widowed, less likely to be married, and more likely to live alone. Latinx older adults are more likely than older Black adults and older White adults to live in households where more than one generation lives together. They are also more likely to be married, making them less likely to live alone.
More than one-third (35 percent) of older adult households in Central Indiana consist of individuals living alone. The oldest-old (those age 85 and older) are much more likely to be living alone (51 percent) compared to the middle-old (34 percent) and younger-old (25 percent). Black older adult households are more likely to consist of those living alone (44 percent) compared to Latinx older adult households (23 percent) and White older adult households (33 percent).
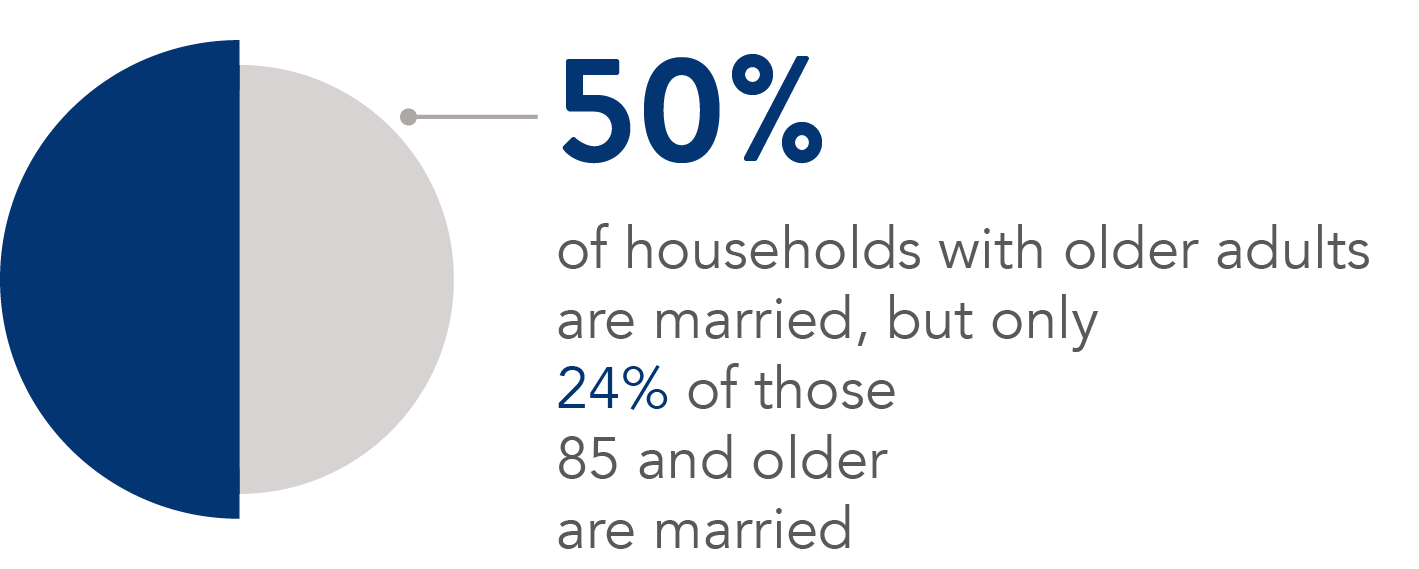
Younger-old and middle-old households are much more likely to be currently married (57 percent and 49 percent respectively), compared to the oldest-old, of which only 24 percent are married. Black older adults are the least likely to be married (30 percent), compared to Latinx older adults (59 percent) and White older adults (54 percent). Among all older adults in Central Indiana, over one-third (32 percent) are divorced, separated, or widowed.
Just under five percent (4.5 percent) of older adults live in households with their grandchildren. This rate is highest for the middle-old (4.7 percent) and lowest for the oldest old (1.0 percent). A larger share of Latinx older adults live with their grandchildren (15.2 percent), while this rate is 7.0 percent and 3.4 percent for Black and White older adults, respectively.

