Food Insecurity

Esther and Raymond
Two years ago, Esther was diagnosed with diabetes and began taking medications for it. At the time, her doctor also recommended lifestyle and dietary changes to slow the progression of the disease. With Raymond’s encouragement, she began walking more and created a meal plan to incorporate more fruits and vegetables into their meals. Lately, however, financial struggles have made it difficult to stick with the plan. One of their children needed help with an unforeseen expense, and a leak in their roof needed required repairs. Then a mechanic told them that their car needs a new transmission and is currently unsafe to drive—but they are postponing the repair work until their financial situation stabilizes. To make ends meet between Social Security checks, Esther and Raymond recently visited the food pantry of a nearby church and received a week’s worth of food. It was the first time they had relied on a food pantry.
Several years ago, the chain grocery store they liked to shop at—just two blocks from their home—closed. The nearest grocery is now more than two miles away. It takes about half an hour to reach on public transit. Because of their car situation, they have begun buying food mainly at a local convenience store. The only produce it stocks are bananas and apples. Mostly, Esther and Raymond buy frozen, prepared meals. They can also get a week’s worth of food once a month from the church pantry. If their old grocery store were still open, they would walk to it and buy fresh produce. Now, they worry that the lack of access to fresh produce and other nutritious food on a regular basis is putting them on a path toward negative health outcomes.

- 11.9 percent of Central Indiana residents age 50-59 were food insecure in 2021. This remained steady even as the national rate declined since 2018. 7.7 percent of Central Indiana residents age 60 and older were food insecure in 2021. This declined from 9.9 percent in 2018.
- According to older adults and service providers, the chief barriers to food access and security are transportation and money.
- Less than ten percent of Central Indiana older adults live in a food desert. The rate is highest in Marion and Shelby Counties. There are 3,300 fewer Marion County older adults in food deserts in 2022 compared to 2021. However, during the same period, the number of older adults living in food deserts in the other counties increased by 2,900.
- The Federal Supplemental Nutrition Assistance Program (SNAP) provides necessary benefits to older adults experiencing poverty, yet only half of eligible adults age 60 and older participate in the program.
FOOD INSECURITY AND FOOD ACCESS
The U.S. Department of Agriculture (USDA) defines food insecurity as households not having the resources for enough food at some point during the year. In 2022, 12.8 percent (17 million) of U.S. households were food insecure, and 5.1 percent (6.8 million) had very low food security, both of which have significantly increased from 2021 (10.2 percent & 3.8 percent respectively). However this is the fifth year in a row where the overall food insecurity rate is below the 2007, pre-recession level. The rate peaked at 15 percent in 2011.1 Nationwide, while adults age 50-59 and age 60 and older experience lower rates of food insecurity (9.4 percent and 7.1 percent respectively) than the general public, their food insecurity rates are still greater than in 2007. 2 3
One out of nine older adults age 50 and older in Indianapolis are food insecure. In 2021, the rate of food insecurity in Indianapolis metro area was 11.9 percent for adults age 50 to 59 and 7.7 percent for those age 60 and older. Both are higher than for the state of Indiana (10.1 percent and 6.2 percent respectively). Furthermore, one out of twenty older adults age 50 and older in the Indianapolis metro area are very low food secure. In 2021, the rate of very low food secure (VLFS) in the Indianapolis metro area was 5.8 percent for adults age 50 to 59 and 4.4 percent for those age 60 and older. 4 5
In Indiana, the food insecurity rate declined for both older adult age groups since 2017, while in Indianapolis the decline was only for the age 60 and older age group. In 2021, of the 51 national metro areas that Feeding America compared, the Indianapolis food insecurity rate for adults age 60 and older ranked as the thirteenth highest (compared to tenth highest in 2017), and ninth highest for adults age 50 to 59 (compared to twenty-sixth highest in 2017). More concerning is the fact that the Indianapolis VLFS rate for adults age 60 and older ranked as the second highest in 2021 (compared to fourth highest in 2017), and seventh highest for adults age 50 to 59 (compared to twelfth highest in 2017). 6 7 8 9
Within the Central Indiana region, finding affordable, quality food is a challenge for some. Both older adults and service providers in Central Indiana report that lack of transportation and money are barriers to food security among this population. For a discussion of transportation issues, see the Transportation section of this report.
In 2023, America’s Health Rankings Senior Report ranked Indiana as 42nd in the nation for enrollment in the Supplemental Nutrition Assistance Program – only half of adults age 60 and older who experience poverty participate in the program.10
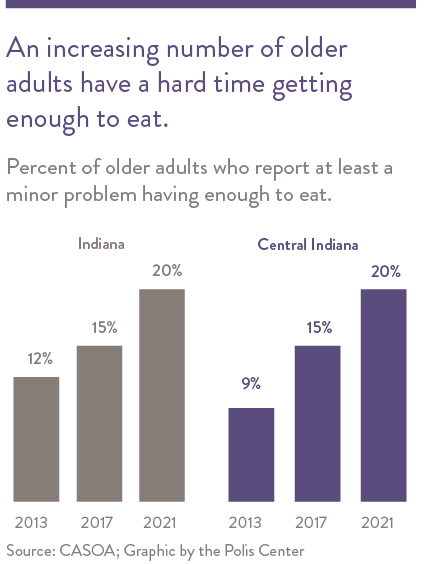
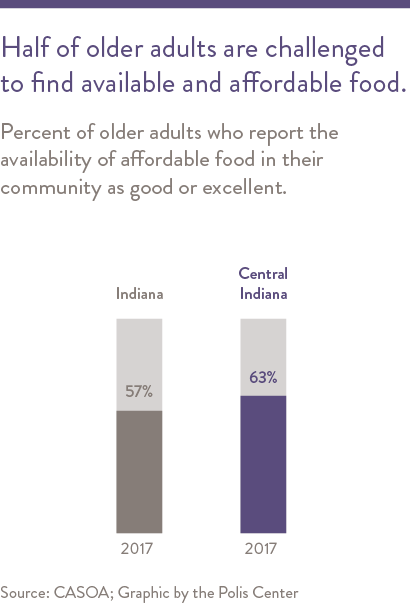
Survey responses related to food and nutrition are mixed. In 2021, the share of older adults (age 60+) in Central Indiana who report the availability of affordable, quality food in their communities as excellent or good fell to 52 percent (compared to 63 percent in 2017), according to the CASOA survey. Twenty percent of older adults in both Central Indiana and Indiana stated that having enough food to eat was at least a minor problem, marking a five-percentage point increase since 2017. In 2013, this rate was only nine percent in Central Indiana, and twelve percent in Indiana.11
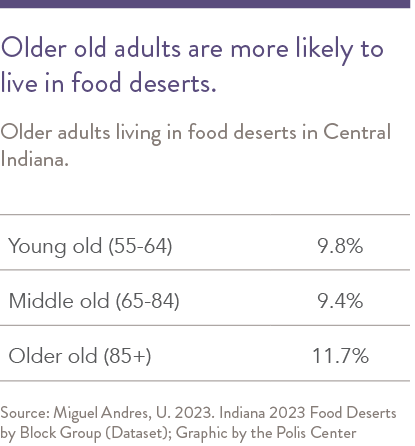
However, access to healthy food has improved for Central Indiana older adults, especially in Marion County. The number of living in food deserts fell to just above 47,500, dropping from 10.1 percent of Central Indiana older adults in 2022 to 9.8 percent in 2023. Older old adults (11.7 percent) are more likely to live in food deserts than young older adults (9.8 percent).
In Marion County, the percent of older adults 55 and over living in a food desert decreased from 16.9 percent in 2022 to 15.3 percent in 2023. This decrease was driven by the net increase of over 20 new healthy food retailers in the county, primarily smaller and ethnic ones. However, all the other counties in the region experienced an increase in the number of individuals living in food deserts. Marion County’s most severe food deserts are in Mid-North, the northeast side, the Far Eastside, the southwest side, and the southside near Beech Grove. However, when looking at the region and removing Marion County from the picture, the region is experiencing an increase in the number food deserts and older adults living in them. The rate of older adults living in food deserts in the “Donut” counties increased from 3.5 percent to 4.5 percent. Hancock County, which had experienced a decrease in people living in food deserts between 2021 and 2022 due to the opening of new stores, had the most severe increase in share and number of older adults living in food deserts. The rate in this county went from 1.0 percent in 2022 to 4.6 percent in 2023. This change seems to have been driven primarily due to the median income in the region growing at a faster rate than that of the neighborhoods in the county.
Similar to last year, counties in the southern part of the region continue to experience increases in their population living within food deserts. However, while the increases experienced between 2021 and 2022 were driven by the reclassification of areas from rural to urban, the increase between 2022 and 2023 seemed to be driven by low food access areas becoming low income as well. As a result, Morgan County increased from 6.2 percent of older adults living in a food desert to 7.4 percent, and Johnson County increased from 7.0 percent to 8.0 percent. Within these counties, food deserts tend to be in the towns and cities of Greenwood, Edinburgh, and Shelbyville.


Increase of the older adult population living in food deserts in all Central Indiana counties but Marion from 2022 to 2023.
Open the legend here >>
In Central Indiana, just over 47,500 older adults live in food deserts.

Needs of Older Adults
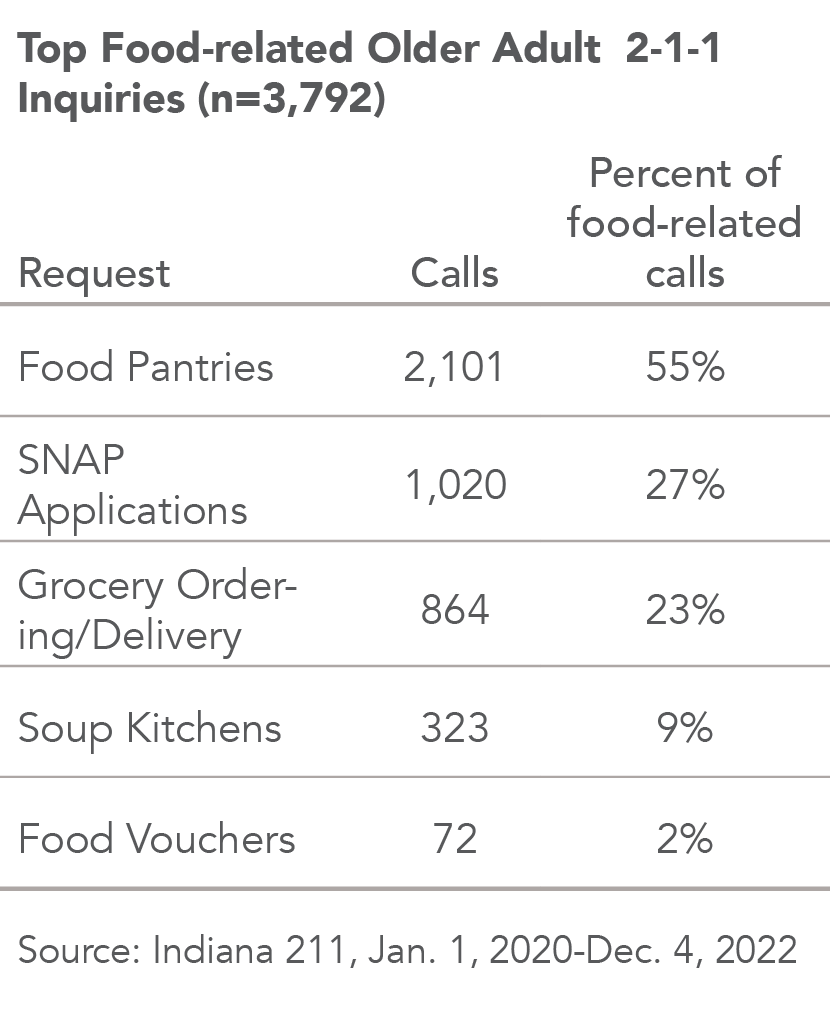
Indiana households experiencing hunger have the option of dialing 2-1-1 to connect with needed services. Between Jan. 1, 2020, and Dec. 4, 2022, there were 3,792 calls to 2-1-1 from Central Indiana adults age 60 and older requesting assistance obtaining food or a meal.12
This is a slight increase compared to 2019 (165 calls per month compared to 147 calls per month). Assistance with SNAP applications accounts for the largest increase in specific needs. In 2019, this need did not fall within the top five needs for older adults, but since 2020, it is the second most frequent food-related need.

Analysis by the Polis Center.


Factors that Influence Access to Food
A variety of factors influence the unequal access to healthy food amongst older adults.
Organizational factors
Access to healthy food options at nearby food stores.
Large supermarkets, which are more likely to be found outside city centers and on thoroughfare roads, have been shown to stock greater amounts of fresh, healthy foods at lower costs. In contrast, smaller grocery stores and convenience stores that are more common in urban areas typically stock a larger proportion of processed, high-fat foods.13 Over the last couple of decades, as full-service grocery stores have left urban and minority populated neighborhoods, the number of convenience stores has increased in these areas. This has increasingly pushed out other full-service retailers, absorbing a higher share of income and food benefits.14

Community factors
Supermarket redlining
As more people settled outside the city limits at the end of the 20th century, supermarkets began to primarily build new stores in suburban areas.15 Simultaneously, over the last two decades, the number of grocery stores in inner-city & historically minority populated neighborhoods has continuously decreased.16 Because these populations already face barriers such as low incomes and high unemployment rates, supermarkets and grocery stores may find that these neighborhoods cannot economically sustain new locations.17 Some food policy experts believe that negative stereotypes of crime and poverty in Black neighborhoods, as well as perceived challenges in hiring and retaining employees, may cause supermarkets to avoid opening stores in these neighborhoods.18 In fact, analyses have shown that at equal levels of poverty, majority-Black census tracts have the fewest number of supermarkets compared to majority-White, majority-Latinx, or integrated neighborhoods.19 This lack of access to healthier food options further exacerbates health disparities among Black older adults and other older adults of color.
Access to transportation
Older adults who do not drive or lack affordable and accessible transportation may struggle to reach distribution centers or grocery stores, particularly in areas with inadequate public transportation infrastructure.20 21 This issue is heightened in urban food deserts, where the percentage of households without access to vehicles is significantly higher than in other urban areas and public transit is normally limited.22 This need for transportation presents specific challenges for older residents in food deserts, as they may face physical limitations when driving, walking or using public transportation. Additionally, they may not be able to afford the travel expenses associated with going to a grocery store.23 Older adults in urban food deserts who do not own a vehicle were 12 percent more likely to report food insufficiency than older adults in the same areas who did own a car.

Interpersonal factors
Social Networks & Isolation
The strength and composition of an older adult’s social support network can affect their food security. Individuals with robust support systems may receive assistance in obtaining groceries, preparing meals, or accessing food assistance programs. In contrast, those lacking such networks and experiencing social isolation face heightened food insecurity as well as limited access to essential resources to fight it. 24 25 26 Similarly, older adults experiencing community disability, any disability preventing individuals from participating in community-based and social activities, experience much higher rates of food insecurity and access to resources.27 28 29 30
Policy factors
SNAP benefits may be falling short, particularly for older adults.
Although many older adults experience food insecurity while living on fixed incomes, they are less likely to participate in the Supplemental Nutrition Assistance Program (SNAP) than younger adults.31 One potential explanation is that limited access to and affordability of transportation to grocery stores and supermarkets diminishes uptake of SNAP benefits among older adults. Another is that the paperwork required to apply and recertify for SNAP is complicated and requires too many extra steps.32 33 As a result, older adults are more likely to drop from SNAP after the initial approval expires or experience several SNAP churning spells, which leads them to rely on other programs, such as Meals-On-Wheels food delivery programs.34 35 36
Food Access and Security Barriers
Both service providers and older adult focus group participants indicated that hunger is a function of both money and access to transportation. An important barrier to obtaining enough food is transportation. In more than one focus group, participants indicated that they have the means to purchase food, but they are sometimes unable to access it due to lack of transportation: “I don’t need to go to the [food] pantry. I just need to go to the store.” One focus group mentioned that the senior center bus that takes them to the grocery store only does this sporadically, due to lack of funding. Older adults clearly see the linkage between lack of transportation and food insecurity in their lives.
Responding to Food Insecurity
According to service providers, many older adults use food pantries as an additional source of food to avoid going hungry between social security payments. These programs include food pantries (190 programs), food vouchers (107 programs) and packed lunches (eight programs). There were also over 100 programs assisting with meals in Central Indiana. These include congregational meals, soup kitchens, meal vouchers and home delivery of meals. CICOA Aging and In-Home Solutions (CICOA), the area agency on aging serving the SoAR geographic area, is the largest organization in Central Indiana providing meal assistance for older adults. CICOA assists seniors through multiple programs, including: 1) frozen meal delivery for home-bound individuals 60 and over; 2) neighborhood congregational meals at over 20 locations; and 3) a voucher program that allows individuals 60 and over to purchase discounted meals at 11 hospital cafeterias and restaurants. These CICOA programs have a suggested contribution of $3.00 per meal.
When asked if they are impacted by food insecurity, focus group participants conveyed different experiences. Some said this was not a problem, while others indicated they can always use extra food when it is available. A variety of opportunities to access additional food were mentioned. These include food pantries and hot prepared meals at senior centers or through Meals on Wheels. Other focus group participants communicated they were unaware of food assistance programs.
Food insecurity and low food access among older adults are influenced not only by cost and availability of healthy food, but by their ability to access it. Access is affected not only by availability of transportation to stores and food pantries, but also by whether the individuals in need are aware of the services that are available. The recent efforts to improve food access among some of the most food insecure neighborhoods in Marion County may help reduce this problem, if used by those in need.
- Rabbitt MP, Hales LJ, Burke MP, Coleman-Jensen A. Household food security in the United States in 2022. Published online 2023. Accessed November 29, 2023. https://www.ers.usda.gov/webdocs/publications/107703/err-325.pdf?v=7814.4
- Ziliak JP, Gundersen C. The State of Senior Hunger in 2021. Published online 2023. Accessed November 29, 2023. https://www.feedingamerica.org/sites/default/files/2023-04/State%20of%20Senior%20Hunger%20in%202021.pdf
- Ziliak JP, Gundersen C. Hunger Among Adults Age 50-59 in 2021: An Annual Report. Accessed November 29, 2023. https://www.feedingamerica.org/sites/default/files/2023-04/Hunger%20Among%20Adults%20Age%2050-59%20in%202021.pdf
- 2023 Senior Report. America’s Health Rankings. Accessed November 29, 2023. https://www.americashealthrankings.org/learn/reports/2023-senior-report
- Central Indiana Older Adults Statistics | CASOA | CICOA. Published April 14, 2022. Accessed November 29, 2023. https://cicoa.org/news-events/research/casoa/
- VisionLink. Indiana 211 Data Dashboard. Accessed November 29, 2023. https://in211.communityos.org/datadashboard
- Bower KM, Thorpe RJ, Rohde C, Gaskin DJ. The Intersection of Neighborhood Racial Segregation, Poverty, and Urbanicity and its Impact on Food Store Availability in the United States. Prev Med. 2014;58:33-39. doi:10.1016/j.ypmed.2013.10.010
- Shannon J. Dollar Stores, Retailer Redlining, and the Metropolitan Geographies of Precarious Consumption. Annals of the American Association of Geographers. 2021;111(4):1200-1218. doi:10.1080/24694452.2020.1775544
- Meyersohn N. How the rise of supermarkets left out black America | CNN Business. CNN Business. Accessed November 29, 2023. https://www.cnn.com/2020/06/16/business/grocery-stores-access-race-inequality/index.html
- The Polis Center. Getting Groceries: Food Access Across Groups, Neighborhoods, and Time. SAVI. Accessed November 29, 2023. https://www.savi.org/feature_report/getting-groceries-food-access-across-groups-neighborhoods-and-time/
- Dutko P, Ploeg MV, Farrigan T. Characteristics and Influential Factors of Food Deserts. Accessed November 29, 2023. http://199.135.94.241/publications/pub-details/?pubid=45017
- Meyersohn N. How the rise of supermarkets left out black America | CNN Business. CNN Business. Accessed November 29, 2023. https://www.cnn.com/2020/06/16/business/grocery-stores-access-race-inequality/index.html
- Bower KM, Thorpe RJ, Rohde C, Gaskin DJ. The Intersection of Neighborhood Racial Segregation, Poverty, and Urbanicity and its Impact on Food Store Availability in the United States. Prev Med. 2014;58:33-39. doi:10.1016/j.ypmed.2013.10.010
- Tackling Food Insecurity: Bringing Data to Communities | Urban Institute. Published December 2, 2019. Accessed December 11, 2023. https://www.urban.org/research/publication/tackling-food-insecurity-bringing-data-communities
- Dabelko-Schoeny H, Maleku A, Cao Q, White K, Ozbilen B. “We want to go, but there are no options”: Exploring barriers and facilitators of transportation among diverse older adults. Journal of Transport & Health. 2021;20:100994. doi:10.1016/j.jth.2020.100994
- Dutko P, Ploeg MV, Farrigan T. Characteristics and Influential Factors of Food Deserts. Accessed November 29, 2023. http://199.135.94.241/publications/pub-details/?pubid=45017
- Fitzpatrick K, Greenhalgh-Stanley N, Ver Ploeg M. The Impact of Food Deserts on Food Insufficiency and SNAP Participation among the Elderly. American Journal of Agricultural Economics. 2016;98(1):19-40. doi:10.1093/ajae/aav044
- Predictors of Food Insecurity among Older Adults in the United States – Goldberg – 2015 – Public Health Nursing – Wiley Online Library. Accessed December 11, 2023. https://onlinelibrary.wiley.com/doi/10.1111/phn.12173
- Tucher EL, Keeney T, Cohen AJ, Thomas KS. Conceptualizing Food Insecurity Among Older Adults: Development of a Summary Indicator in the National Health and Aging Trends Study. The Journals of Gerontology: Series B. 2021;76(10):2063-2072. doi:10.1093/geronb/gbaa147
- Howe-Burris M, Giroux S, Waldman K, et al. The Interactions of Food Security, Health, and Loneliness among Rural Older Adults before and after the Onset of COVID-19. Nutrients. 2022;14(23):5076. doi:10.3390/nu14235076
- Keeney T, Jette AM. Individual and Environmental Determinants of Late-Life Community Disability for Persons Aging With Cardiovascular Disease. American Journal of Physical Medicine & Rehabilitation. 2019;98(1):30. doi:10.1097/PHM.0000000000001011
- The Polis Center. SNAP Policy and Usage by Older Adults During the COVID-19 Pandemic | The State of Aging in Central Indiana. Accessed November 29, 2023. https://centralindiana.stateofaging.org/2022/10/07/snap-policy-and-usage-by-older-adults-during-the-covid-19-pandemic/
- Heflin C, Hodges L, Arteaga I, Ojinnaka CO. Churn in the older adult SNAP population. Applied Economic Perspectives and Policy. 2023;45(1):350-371. doi:10.1002/aepp.13288
- Jones JW, Courtemanche C, Denteh A, Marton J, Tchernis R. Do state Supplemental Nutrition Assistance Program policies influence program participation among seniors? Applied Economic Perspectives and Policy. 2022;44(2):591-608. doi:10.1002/aepp.13231
- Fitzpatrick K, Greenhalgh-Stanley N, Ver Ploeg M. The Impact of Food Deserts on Food Insufficiency and SNAP Participation among the Elderly. American Journal of Agricultural Economics. 2016;98(1):19-40. doi:10.1093/ajae/aav044
