Limitations and opportunities with public transit for an aging population in Central Indiana
Many older adults in Central Indiana rely on public transit to maintain their independence. However, transit options are often not well-known nor easily accessible. This State of Aging in Central Indiana Report (SoAR) research brief addresses important aspects of public transit accessibility for older adults in Central Indiana.
- Older adults travel a shorter distance to a bus stop than any other age group in Marion County. On average, adults age 65 and older travel one-tenth of a mile to reach a bus stop. Other adults (age 16 or older) travel an average of 24-38 percent farther to reach a bus stop.
- Three quarters of older IndyGo riders travel less than a quarter mile to a bus stop. Only about one-third of older adults in Marion County live that close to a bus stop.
- Rural and urban demand transit are the most inefficient means of transit in Indiana in terms of transit financial expenditures per rider, but these are often needed for older adults. To efficiently improve transit access where older adults live, a combination of planned housing and coordinated regional transit development is needed.
Introduction
Within Central Indiana, public transit access is critical for many older adults to participate in essential activities such as shopping, health trips, and social activities.1In fact, greater access to public transit for older adults may decrease prevalence of depression2, particularly because better transit access can alleviate social isolation in older adults.3However, public transit access in rural areas is commonly worse than that in urban areas. Furthermore, rural areas oftentimes have greater proportions of both older and sicker populations—partly due to trends such as younger adult out-migration, cost of living disparities, and rural areas being more desirable for retirement.4
Marion County Urban Transit
In Marion County, areas with a greater number of older adults tend to be more suburban and have less public transit access. Census tracts with a greater number of adults age 65+ have a greater average distance to travel to IndyGo bus stops and a lower transit density based on miles of bus service per week. Within these census tracts, the average distance to the closest bus stop can commonly be upwards of half a mile. Distance to a bus stop can be a significant barrier to transportation access for older adults.
The 2016 IndyGo ridership survey measured the starting location of transit trips, such as a home or business, and the bus stop where riders boarded. Adults age 65+ traveled an average of one-tenth of a mile (531 feet) from their starting location to a bus stop, less than any other age group surveyed. Three quarters of older riders traveled less than 1200 feet to a bus stop, or just under one quarter mile.5
Assuming 1200 feet is the furthest most older adults are willing to travel to a bus stop, Polis analysts estimate 76,426 older adults in Marion County are farther from a bus stop than they will willingly travel. This threshold distance of close to a quarter mile is similar to earlier research that found older adults are three times more likely to use public transit if they were within about one-eighth of a mile from a bus stop as opposed to a quarter of a mile.
Older adults and children tend to travel the shortest distance to a bus stop
Median distance in feet traveled to bus stop by age group
On average, it’s farther to bus stops in the outskirts of Marion County.
Median distance from the center of each census tract to the closest bus stop
There are more older adults in suburban Marion Co. who are likely too far from a bus stop to easily use.
Older adult population living farther than a fifth of a mile from a bus stop.
Access to particularly important destinations for older adults using IndyGo
For many older adults, specifically those age 5 and up, public transit is imperative for social, personal, religious trips, and shopping. Collectively, these destinations make up about two thirds of IndyGo trips for adults age 65 and over, with an additional 12 percent of trips for medical purposes. Thus, assessing transit access to these destinations is essential for determining the usefulness and appeal of public transit for the older adult population.
Using a standard transit time of 8 a.m. on a weekday (Monday) and theoretical starting locations at the centroid of each census tract in Marion County, the extent an individual can travel within 30 minutes via walking and public transit may be estimated. Based on network analysis, it is clear that there are many tracts where it is unlikely for an individual to reach a health clinic or grocery store within 30 minutes without the help of a car. This analysis illustrates several census tracts where current transit gaps exist. These fall in not only suburban parts of Marion County, but also urban census tracts where an IndyGo service line currently does not run.8
Detailed data look:
Distance from rider origin to initial bus stop by age group
(Click the image to enlarge it.)
Access to grocery stores is greatest along IndyGo routes.
Number of grocery stores reachable from the center of each tract in 30 minutes on transit
Leaving at 8 a.m. Monday, including wait time for bus
Access to places of worship is greater than any other target destination.
Number of places of worship reachable from the center of each tract in 30 minutes on transit. Note that individuals are likely to be more selective about places of worship they would actually attend.
Leaving at 8 a.m. Monday, including wait time for bus
Travel to health clinics is easiest in downtown Indianapolis.
Number of clinics reachable from the center of each tract in 30 minutes on transit
Leaving at 8 a.m. Monday, including wait time for bus
IndyGo plans to continue increasing local bus service with increased frequency and two additional rapid transportation lines through their proposed 2023-2027 future service plan. IndyGo will particularly target transit-critical population zones with increased frequency, improving the reach of 15-minute or better travel frequency for minority communities, zero-vehicle households, and low-income households. While this will improve access for many older adults, this future service plan is focused along pre-existing routes, and will not expand access to less urban areas in Marion County where older adults are more likely to reside.
IndyGo experienced a decline in ridership of 46 percent between February 2020 and February 2022 spurred by the COVID-19 pandemic. Ridership dropped from 2020 to 2021 in Indianapolis more than any other large, fixed route system in Indiana. IndyGo rider fare revenue also decreased substantially from 2019 to 2021, dropping from $9.6 million in 2019 to $5.7 million in 2021. The new, proposed changes to IndyGo routes can help reverse these trends and improve transit options for older adults in Marion County. However, one key obstacle that remains is the shortage of IndyGo drivers. This has been a continual challenge for IndyGo since the start of the Covid pandemic, resulting in many drivers working overtime and IndyGo functioning well below driver-operator goals. Once this key issue is addressed, the 2023-2027 IndyGo future service plan hopefully will increase accessibility and frequency of public transit routes, so that older adults can experience more autonomy in accomplishing daily tasks and avoid instances of social isolation.
Transportation outside of Marion County
While the IndyGo future service plans will hopefully improve transit access for older adults traveling in Marion County, alternative transit options are necessary to service the large, older adult population living in the outer counties of Central Indiana (e.g., Boone, Hamilton, Hendricks, Johnson, etc.). While there are currently many different types of public transit available in the counties surrounding Marion County, many require scheduling transportation 24-48 hours in advance or are first come-first served. Additionally, several of these transit options for older adults in the surrounding counties are more expensive than public transit options within Marion County. For example, trips on IndyGo bus routes are $0.85 for persons age 65 and older with a Government Issued Medicare Card or persons with disabilities and an IndyGo Half Fare ID Card, while services such as Hamilton County Express have fares that are $3 one-way/$6 round trip or LINK Hendricks County, which is $6 round trip within a town, or $8 round trip within the county. Barriers such as scheduling transportation far in advance, fewer routes/stops, and higher costs serve to potentially limit public transit usage by older adults in more rural Central Indiana.
The new CICOA 2022-2023 Aging & In-Home Solutions guide is also now available, which contains information on several Central Indiana transit options for older adults.
Example of barriers and challenges for older adults with transit in outlying counties of Central Indiana
Demand-response trips, the kind of public transit that is available in rural and suburban counties, can be complicated to navigate. The fares vary between systems and for different types of riders. Advance scheduling requirements vary from same-day to a week or more ahead of a trip. And different counties' systems do not connect well. These hypothetical example trips illustrate the challenges of navigating rural and suburban transit.
She has used Access Johnson County Transit to transfer to IndyGo buses that can take her right to Eskenazi Health. Unfortunately, this can take upwards of three hours one way. Stacy would use the Access Johnson County demand transit service, but cannot cover the $4 per zone ride this would require. Another option Stacy has tried is the Johnson County Senior Services, which is free. However, she has found it difficult to meet the advance scheduling requirement of at least four days, and the service only takes her as far north as Southport Road, where she still must transfer to IndyGo.
While Stacy appreciates being able to get to downtown Indianapolis on her own, she must navigate the inherent difficulties of rural-to-urban transit in Central Indiana.

Johnson County to Downtown Indianapolis
Walk to Johnson County Courthouse
10 minutes
Take Franklin West bus to Walmart
Access Johnson County Zip Line
$1.00 - 21 minutes
Take Zip North bus to Greenwood Park Mall
Access Johnson County Zip Line
Free transfer - 45 minutes
Take Route 31 to Transit Center
IndyGo
$1.75 - 59 minutes
Take Route 37 to Eskanazi
IndyGo
Free transfer - 13 minutes
One-way cost: $2.75
One-way time: 3 hr 15 min
This trip is affordable but takes a very long time. Solutions might include regional rapid transit or subsidized ride-sharing.
Harry would like to still run errands while Sally is away at work, but needs an alternative form of transportation. Harry likes shopping at Wal-Mart, but the closest one is in Lebanon, Indiana. He has tried using Boone County Senior Services for demand transit, but sometimes has difficulty reserving a spot ahead of time, although he does appreciate that it is free for adults over age 60. He isn't really sure of other options where he can schedule transit with less notice, particularly because his needs are non-medically related.

Whitestown to Lebanon
Call to reserve trip
Boone County Senior Services
1-2 week ahead
Take ride from home to Walmart
Boone Area Transit System
Suggested donation - 20 minutes
One-way cost: Donation only
One-way time: 20 min
This trip is affordable and fast but requires a reservation 1-2 weeks ahead of time. This is useful for planned errands, like groceries, but not for last-minute needs. Solutions might include subsidized ride-sharing.

Rural Morgan County to Morgansville
No service available
Morgan County Connect ends service at 5 pm.
Cannot complete trip
This trip cannot be completed because the demand response service in Morgan County ends at 5 pm. Solutions include extended hours for demand response, a carpool, or subsidized ride-sharing.
Assessing transit needs in outlying Central Indiana counties
Part of the difficulty in assessing transit needs and opportunities in more rural parts of Central Indiana is the sparseness of data from transportation services here, particularly demand-response and paratransit services that many older adults rely on. Research has illustrated the need for more detailed demand response transit data to evaluate where service improvements should be implemented, particularly data such as the amount of trips turned down, minimum reservation time needed, service eligibility, and service area. More detailed surveys filled out by transit agencies within states can provide this important information, which has already been shown by researchers to help identify specific areas with the greatest mobility needs, as well as bolster paratransit/demand-response data in the National Transit Database (NTD).
Cost-effective transit solutions in less dense areas where older adults tend to reside can be difficult though, particularly because there are currently fewer fixed routes and more transit demand services. Both rural/urban demand response transit services and small fixed route costs per rider in surrounding Central Indiana counties are greater on average than urban large fixed routes, such as within Marion County. This disparity between the cost of fixed and demand response service is eliminated though when instead evaluating transit agency costs based on total expenditures per vehicle mile traveled. This illustrates just how much farther vehicles have to travel per rider in less densely populated areas in Indiana.
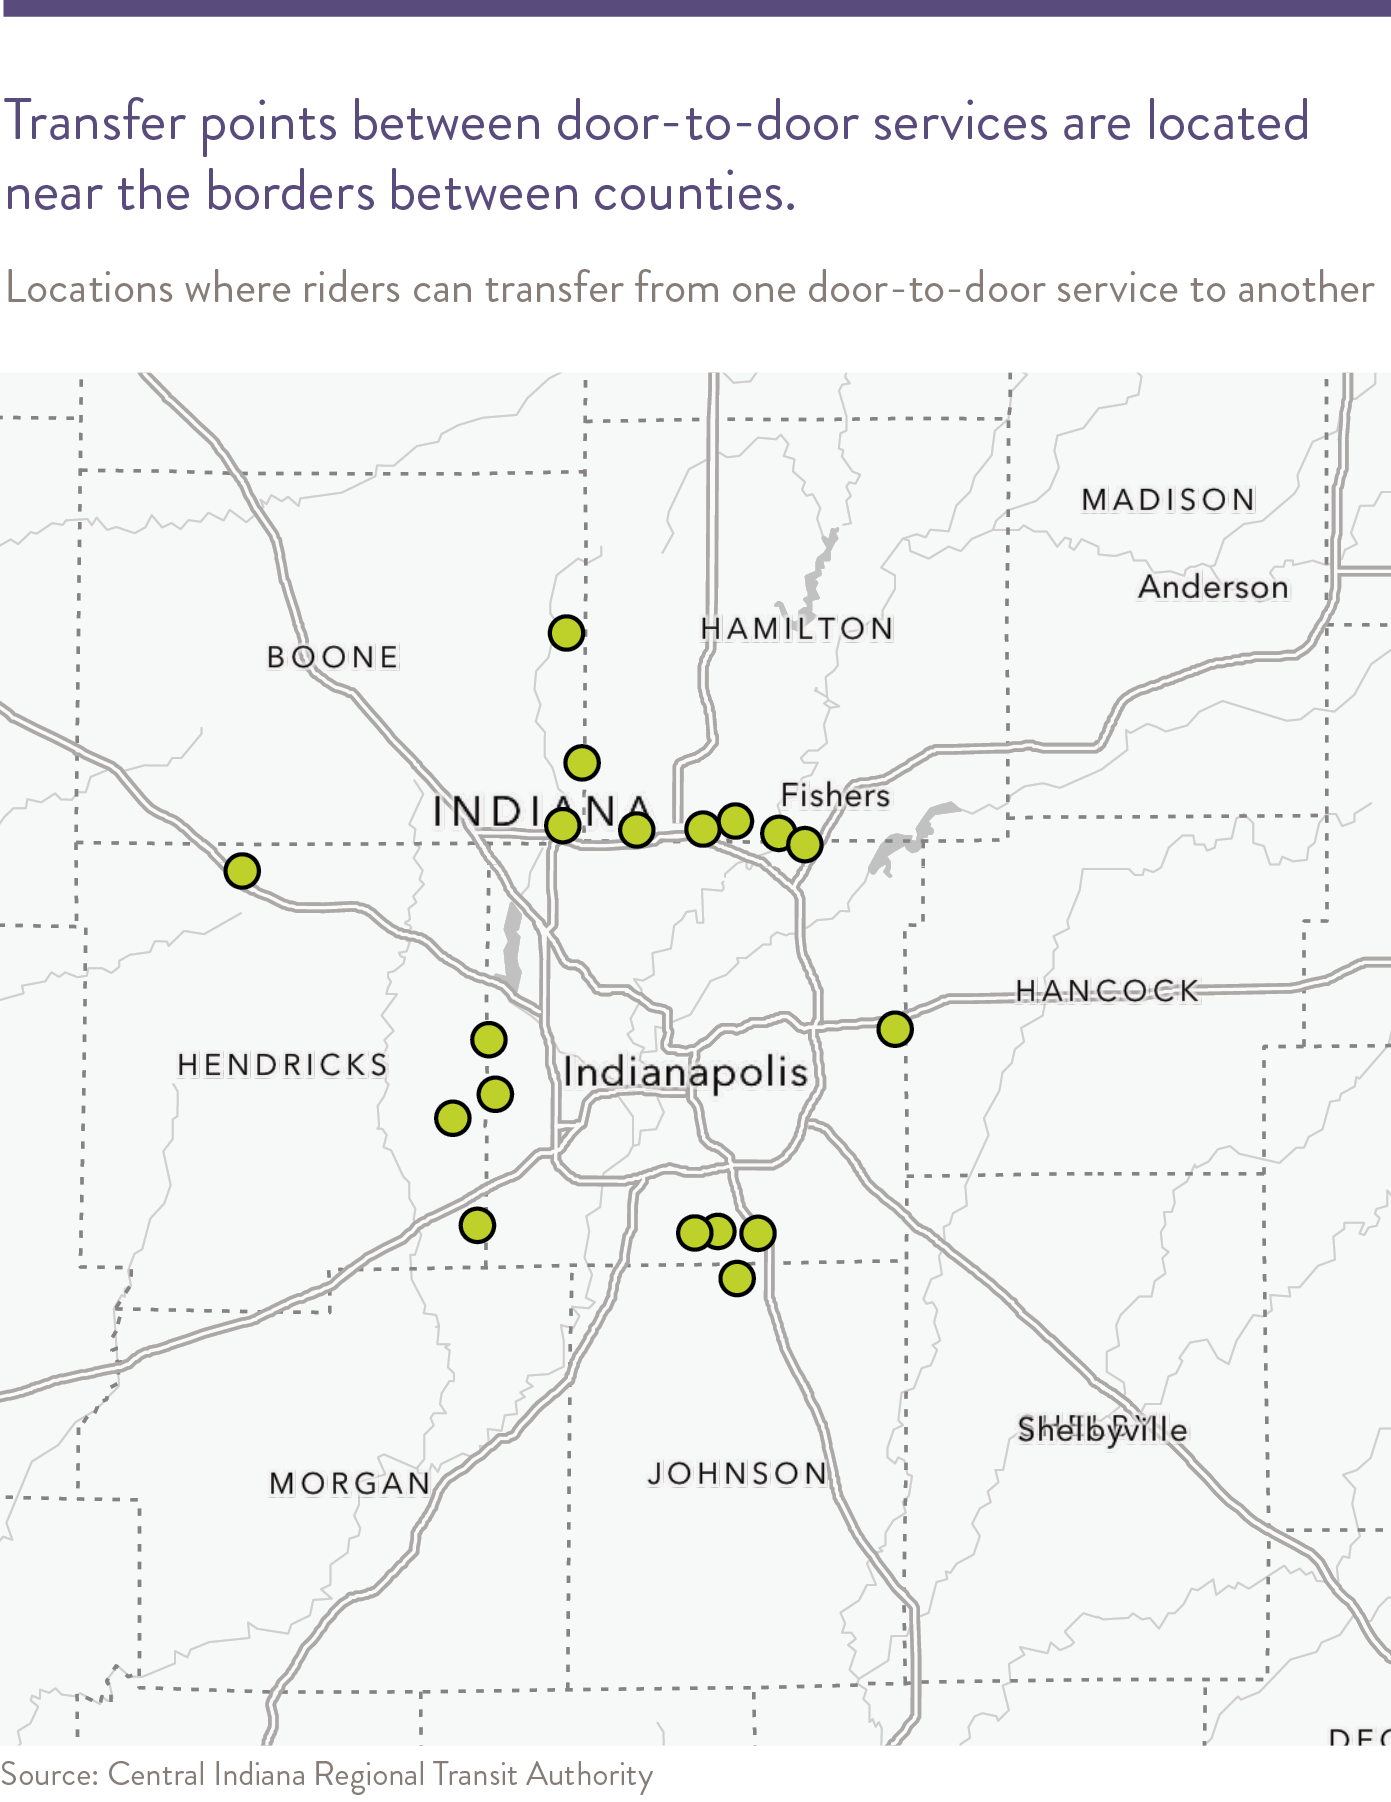
Cross-county travel limitations in Central Indiana
Costs per rider for agencies is high for on-demand transit services.
Often these are the only services available for rural or suburban residents.
But cost per mile is more similar across transit types.
Suburban and rural transit systems travel farther per rider.
In order to improve transit access for older adults throughout Central Indiana in the coming years, a solution likely will involve a combination of transit methods and planned development. This is particularly needed for counties outside of Marion County, where many older adults will live in the future, but where transit is currently least accessible, particularly for cross-county transit. While demand response is less cost-effective than fixed route services per rider, on average, it is necessary to meet the current demands based on where older adults tend to live. Suburban and rural areas simply do not have enough population density to support efficient, sustainable fixed transit systems. Demand response transit is particularly imperative for the oldest old (age 85+), where many may have mobility limitations.
However, with a rapidly aging population in both Central Indiana and the United States in general, planned future development of older adult housing and communities in conjunction with public transit access may help make demand response transit more efficient. Planned development may allow integration of demand response transit with new fixed route systems, much like the shuttle service provided in Marion County with the CICOA Way2Go Transportation Service.
Transit systems work best when they connect dense population centers to clustered destinations, rather than connecting a dispersed population to dispersed destinations. There is demand for such communities among older adults. According to survey data from the Central Indiana Smartgrowth Survey (2018), among Baby Boomers:
- One quarter are interested in moving in the next few years
- Four in ten say sidewalks and cultural amenities are important in the place they choose to live
- One quarter desire shops and restaurants within walking distance
- One-fifth want to live in a place with available public transit
Thus, while many other qualities of suburban or rural living also appeal to older adults, walkable, mixed-use neighborhoods oriented around existing transit lines can be developed to meet market demand.
- SAVI Community Trends, “Who rides the bus: Examining transit ridership in Marion County,” Fall 2017 https://viewer.joomag.com/who-rides-the-bus-examining-transit-ridership-in-marion-county-who-rides-the-bus/0799123001505320723?short
- Yang, Y., Langellier, B. A., Stankov, I., Purtle, J., Nelson, K. L., & Diez Roux, A. V. (2019). Examining the possible impact of daily transport on depression among older adults using an agent-based model. Aging & mental health, 23(6), 743-751.
- Lamanna, M., Klinger, C. A., Liu, A., & Mirza, R. M. (2020). The association between public transportation and social isolation in older adults: A scoping review of the literature. Canadian journal on aging/La Revue canadienne du vieillissement, 39(3), 393-405.
- Jensen, L., Monnat, S. M., Green, J. J., Hunter, L. M., & Sliwinski, M. J. (2020). Rural population health and aging: toward a multilevel and multidimensional research agenda for the 2020s. American Journal of Public Health, 110(9), 1328-1331.
- The actual 75th percentile of data is 358 meters, or 1174.5 feet.
- No statistically significant difference (p < 0.05) found. For box plots generated in this report, the grouped nonparametric Kruskal-Wallis p-value represents the likelihood that all age groups are statistically the same, and paired two-sample nonparametric Wilcoxon rank sum tests (Mann Whitney test) represent the likelihood that both groups are from the same population.
- It is noted that the overall sample size (n = 152) becomes reduced to much smaller numbers when subgrouping by 5 different races/ethnicities for adults age 65 and over.
- There are slight negative correlations between older adult (age 65+) population in census tracts and the amount of grocery stores, health clinics, and places of worship within 30-minute access. However, this 30-minute access estimation makes assumptions about walking time and mobility that may not hold true for many members of the older adult population.
-
Here, the box and whisker plots display distance (in meters) from an IndyGo riders' point of origin to their initial bus stop, grouped by age. We display meters here instead of feet or miles like in the rest of the research brief. Meters are the conventional way to report data for comparison internationally in the peer-reviewed literature, and are how these values were originally calculated through programming equations. One meter is approximately 3.3 feet, and 1609 meters are in a mile. The y-axis is log10 transformed, to normalize appearance of the data and make it fit on one axis. Distance is geodesic, meaning it is point-to-point shortest distance along a path, but takes into account curvature of the earth.
The horizontal line within the boxes represents the median. The whiskers represent the range in which the middle 50% of riders fall. The p-values at the top of the figure indicate if the age groups are likely to truly be different from one another, or if differences occur just because of random variation. Differences in distance to the bus stop are statistically significant (p < 0.05) between older adults and all other age groups except children. The letter "n" represents the number of samples in each age group.