Gaps in Life Expectancy Across the Lifespan
Key findings include:
- The gap between the longest- and shortest-living ZIP codes is highest for the most vulnerable populations: youth and older adults.
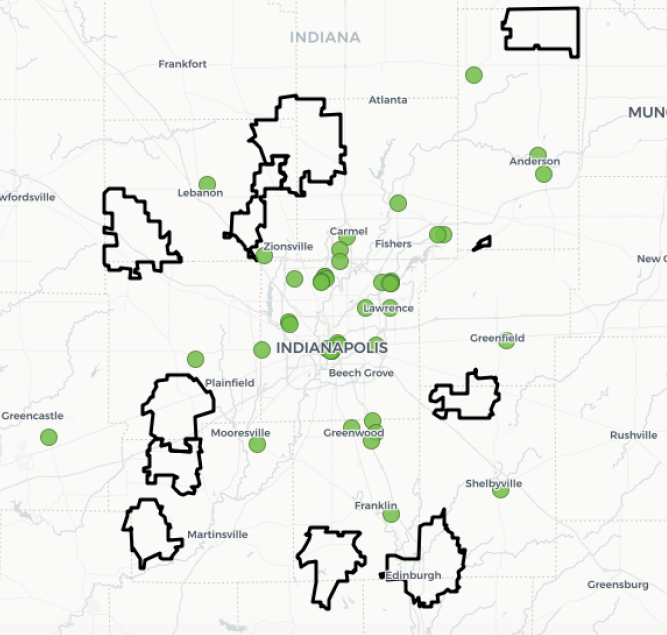
- Low life expectancy is concentrated in the core of Indianapolis from birth to age 45. But at age 75, most concentrated areas of low life expectancy are rural.
- Rural ZIP codes with low life expectancy also tend to be far from medical care, such as hospitals, community clinics, and pharmacies.
- Transportation challenges in rural communities exacerbate issues of health care access.

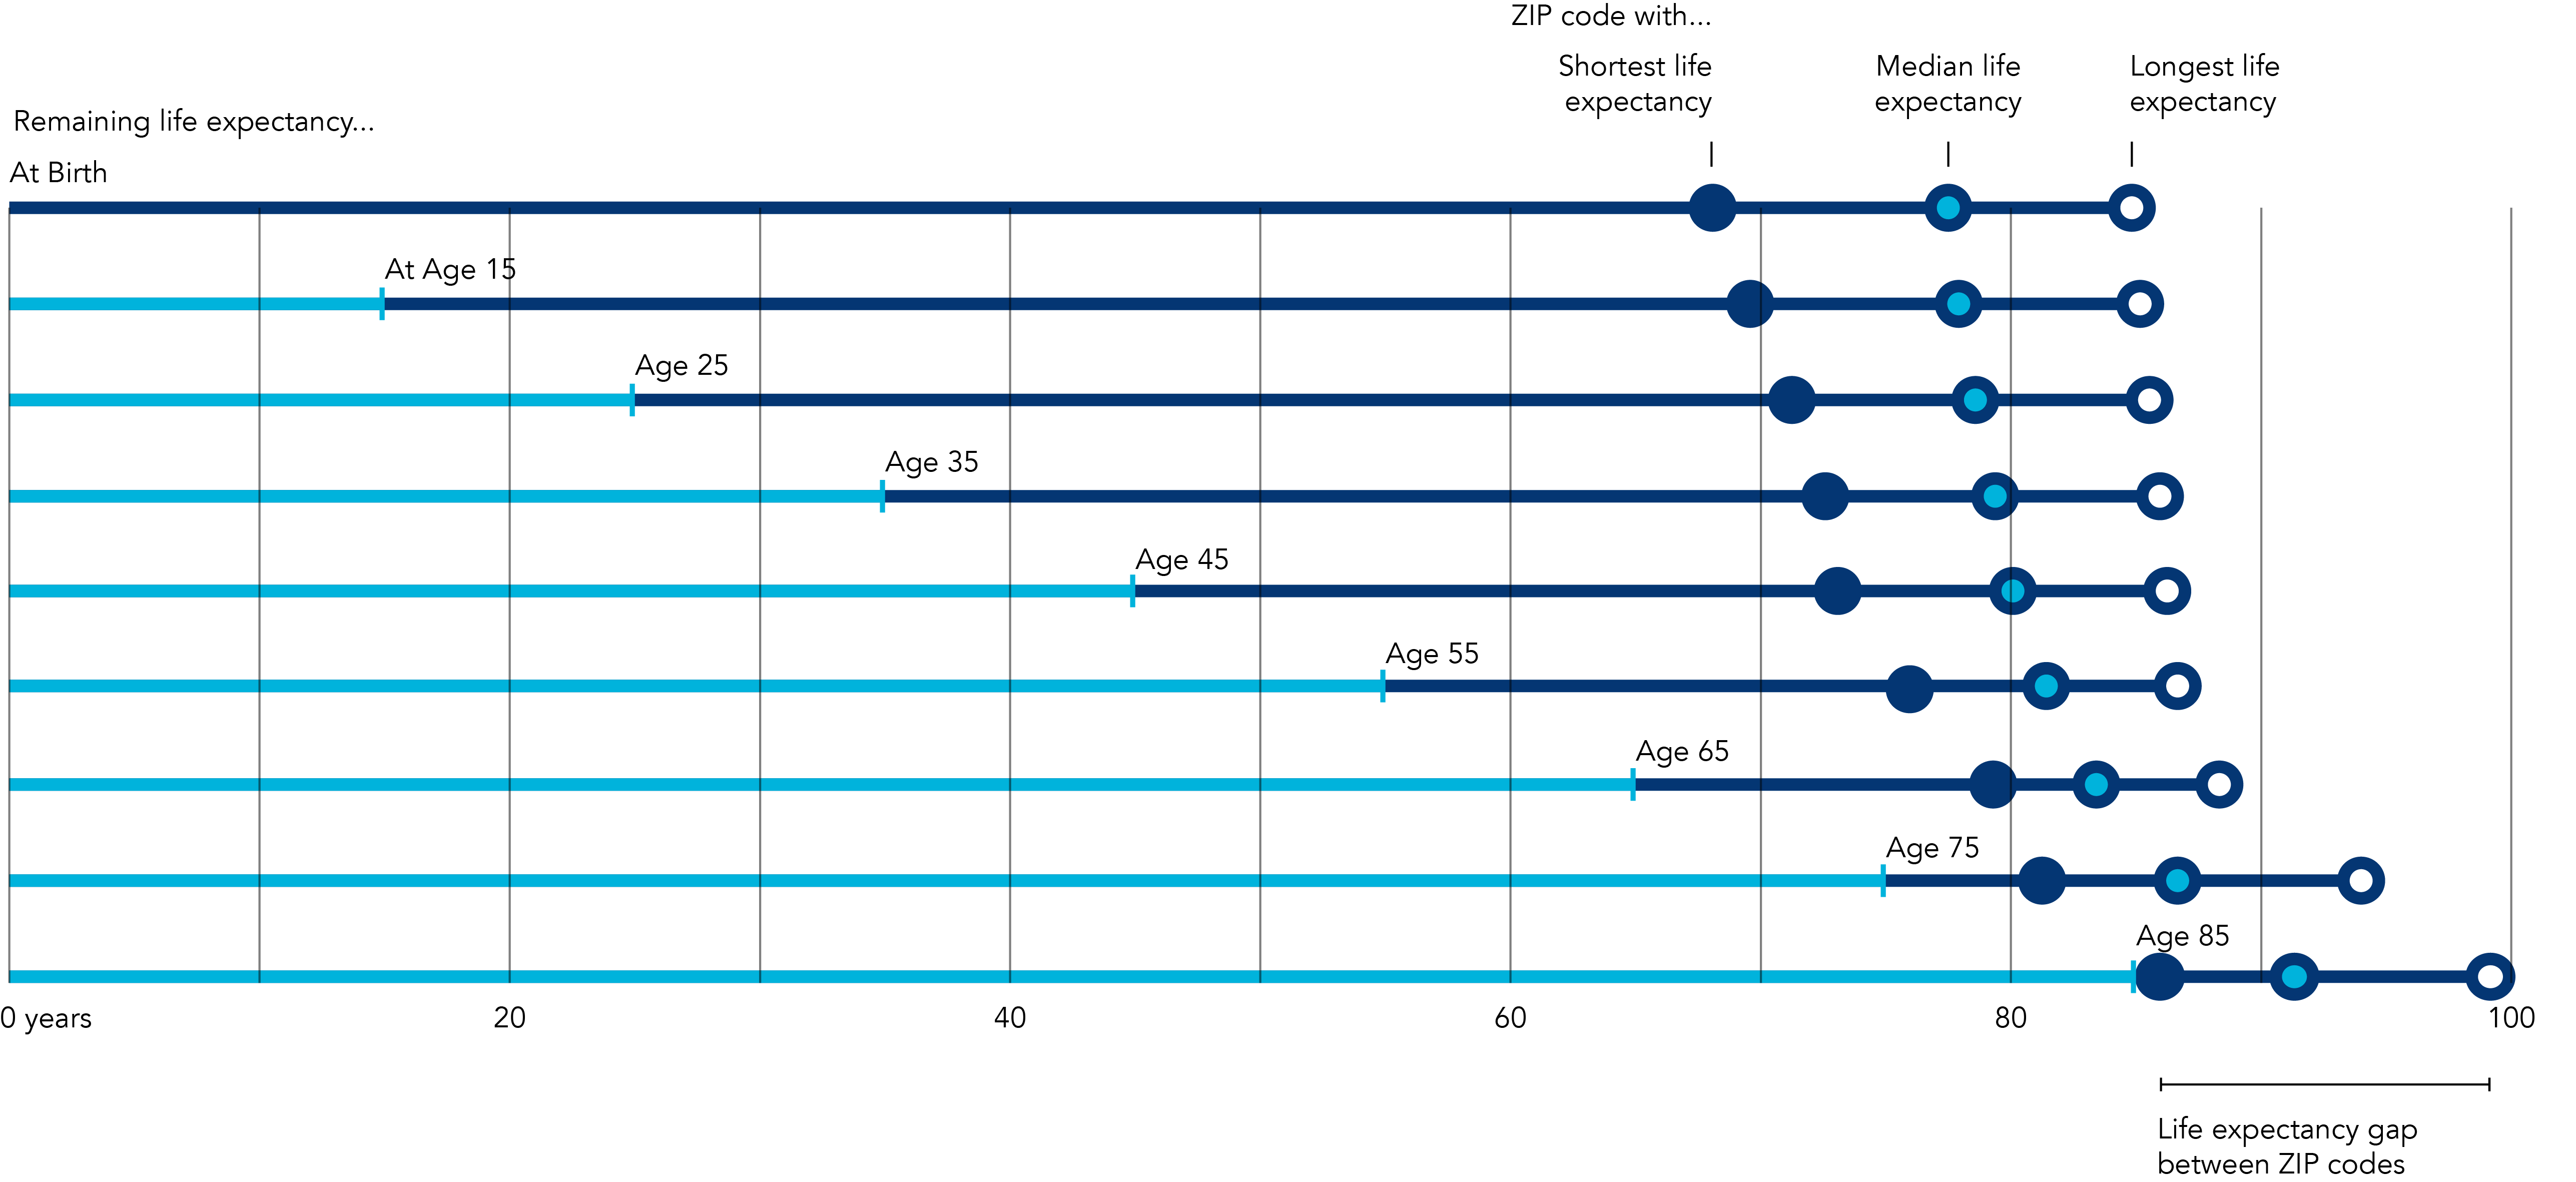
How to interpret this chart
This chart shows how life expectancy changes over time and varies by ZIP codes. Each bar represents life expectancy for people that have reached a particular age, from birth to age 85. The dark blue dot is the average life expectancy in the lowest ZIP code. The middle dot is the average life expectancy in the middle (or median) ZIP code, and the white dot is the average life expectancy in the highest ZIP code. Note that the highest and lowest ZIP codes are not necessarily the same for each age group.
What we can learn from this chart
Each additional year an individual survives increases their expected lifespan. For young people, this trend is most pronounced for ZIP codes with low life expectancy. (The dark blue dots show more increase than the white dots.) The “floor” for life expectancy seems to increase quickly, indicating that death in childhood has a big impact on ZIP codes with low life expectancy.
Beginning at age 55, life expectancy begins to increase across the entire range of ZIP codes. (Dark blue and white dots all show increases.) In fact, because the high end of the range increases so quickly, the life expectancy gap begins to grow.
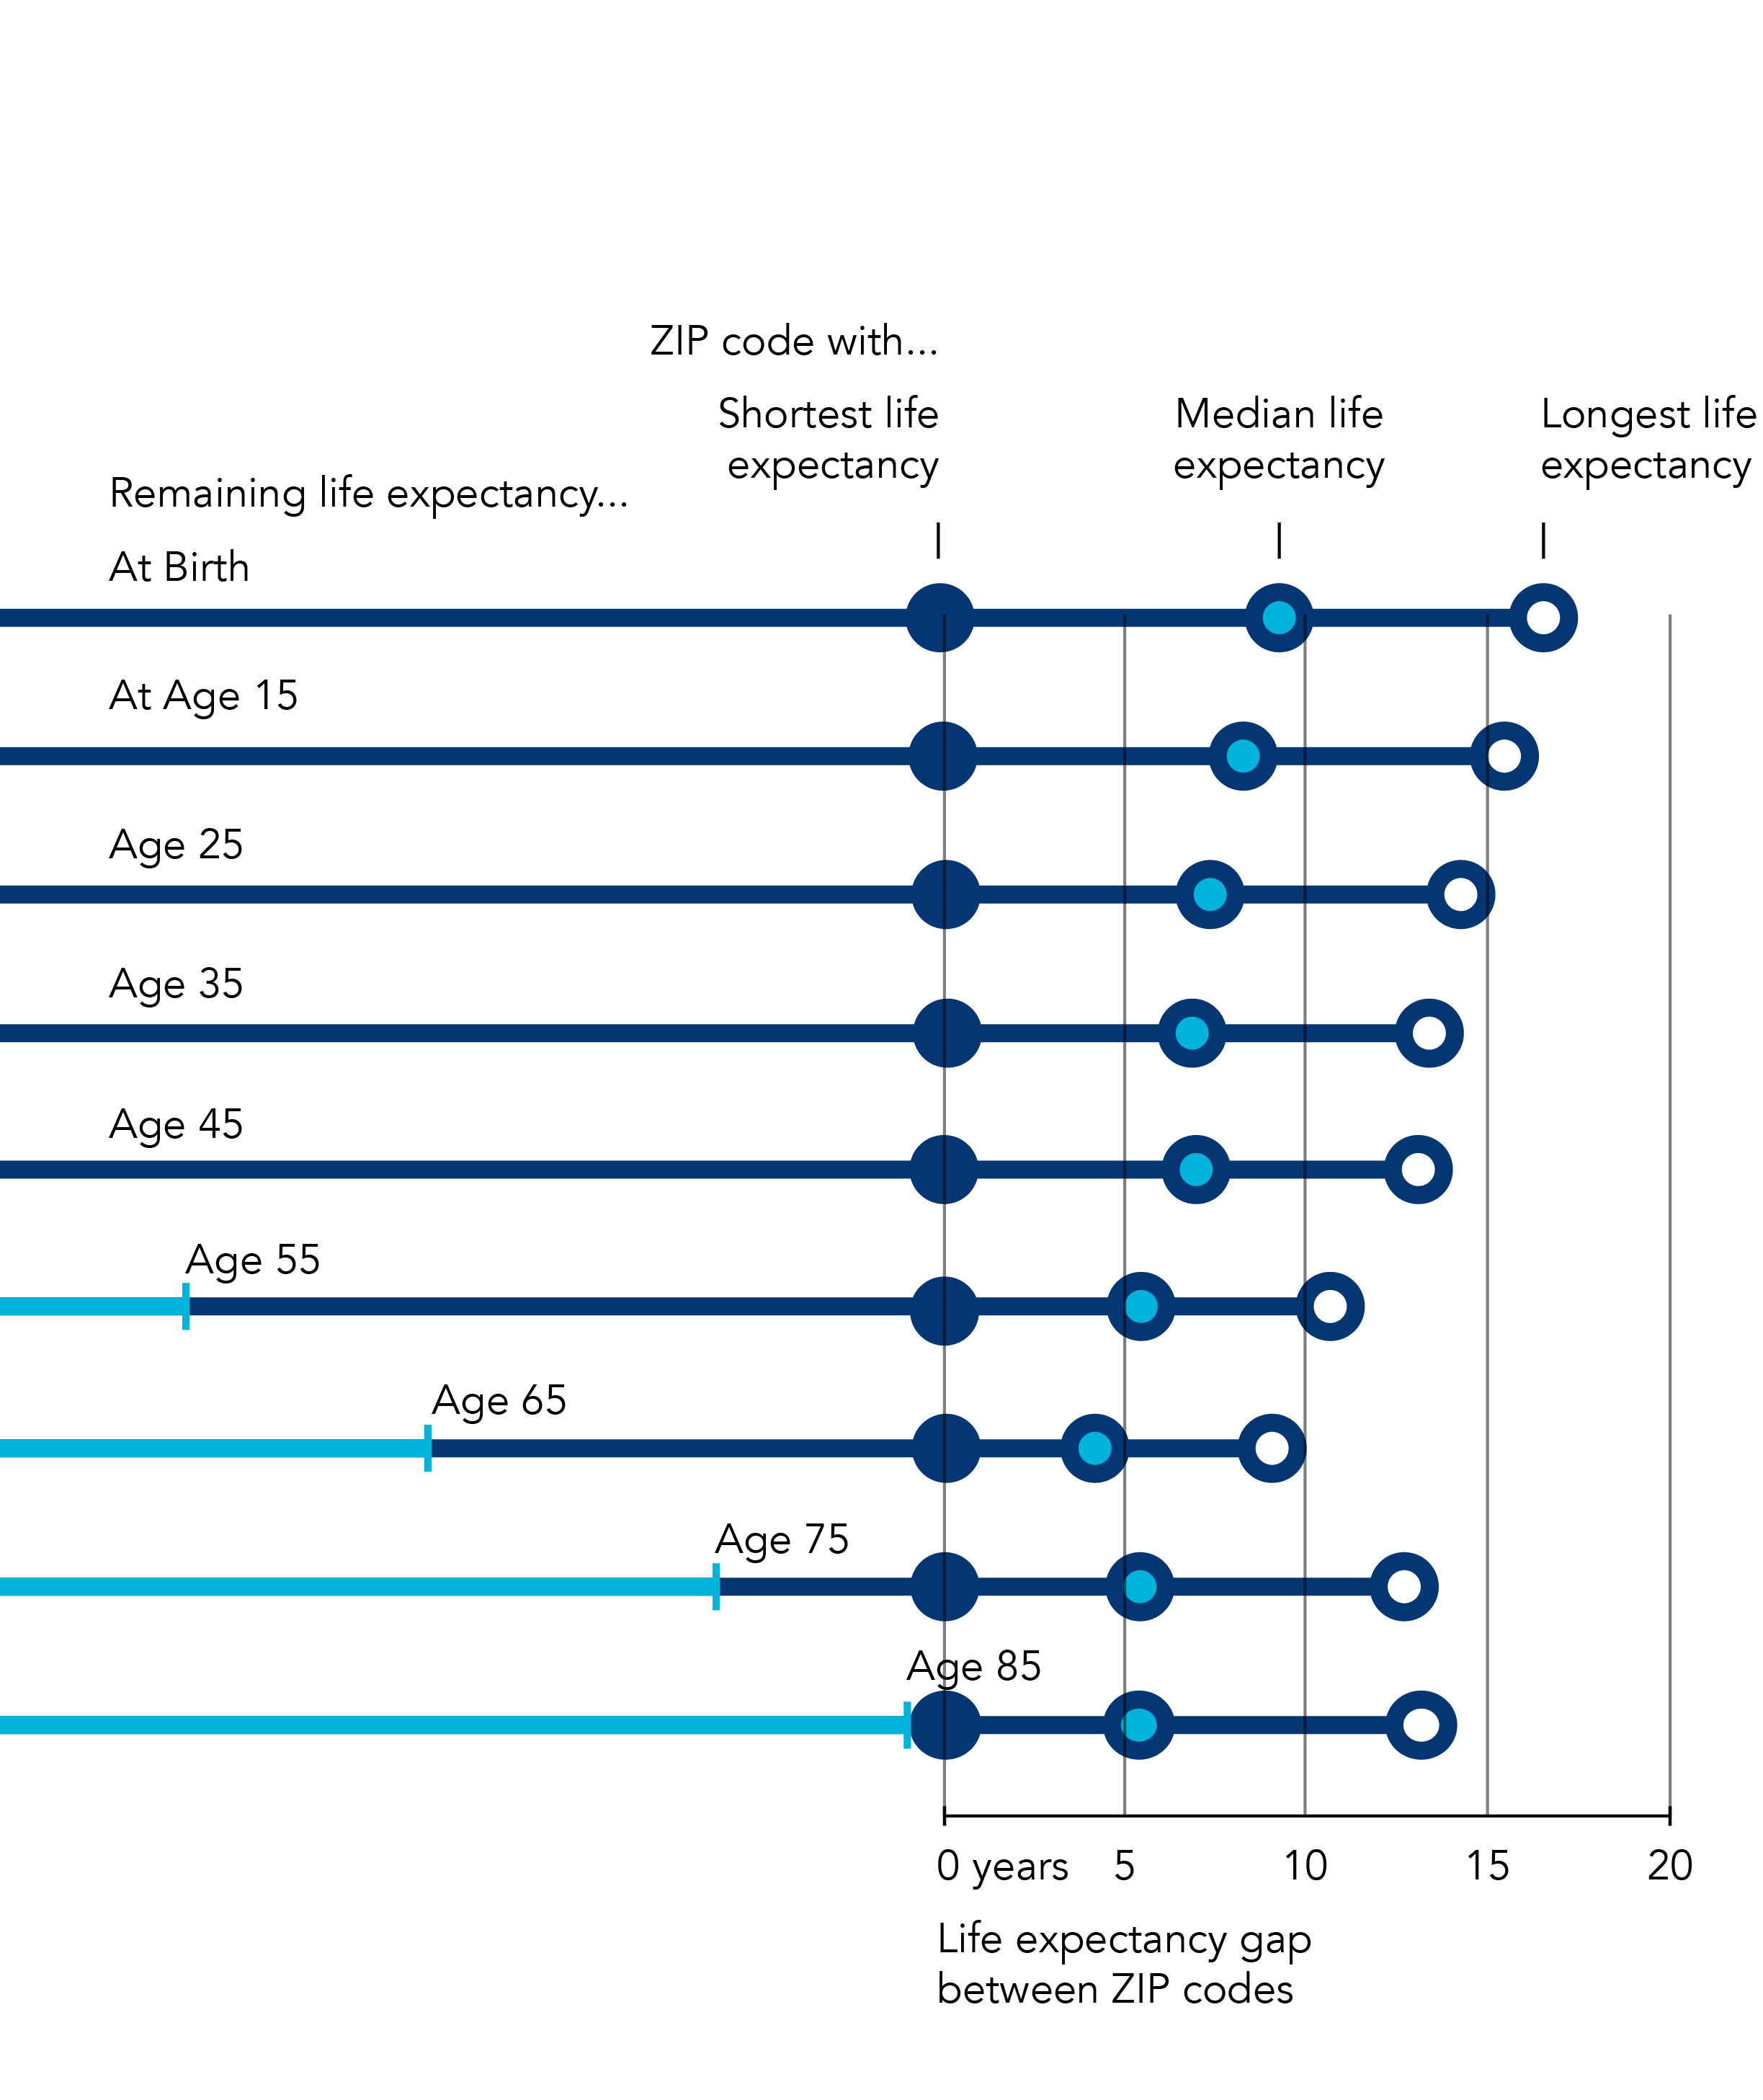
Comparing the Life Expectancy Gap across Ages
By reorienting that chart so the lowest life expectancy ZIP codes (dark blue dots) are aligned, we can directly see the life expectancy gap at each age. The gap is at its smallest at age 65 (11.6 years) but grows again to reach 13.9 years at age 85. For someone who survives until 85, they can expect to live an average of one more year in ZIP code 46184, but nearly 15 more years in 46225.
Geography of Life Expectancy Gap Changes across Ages
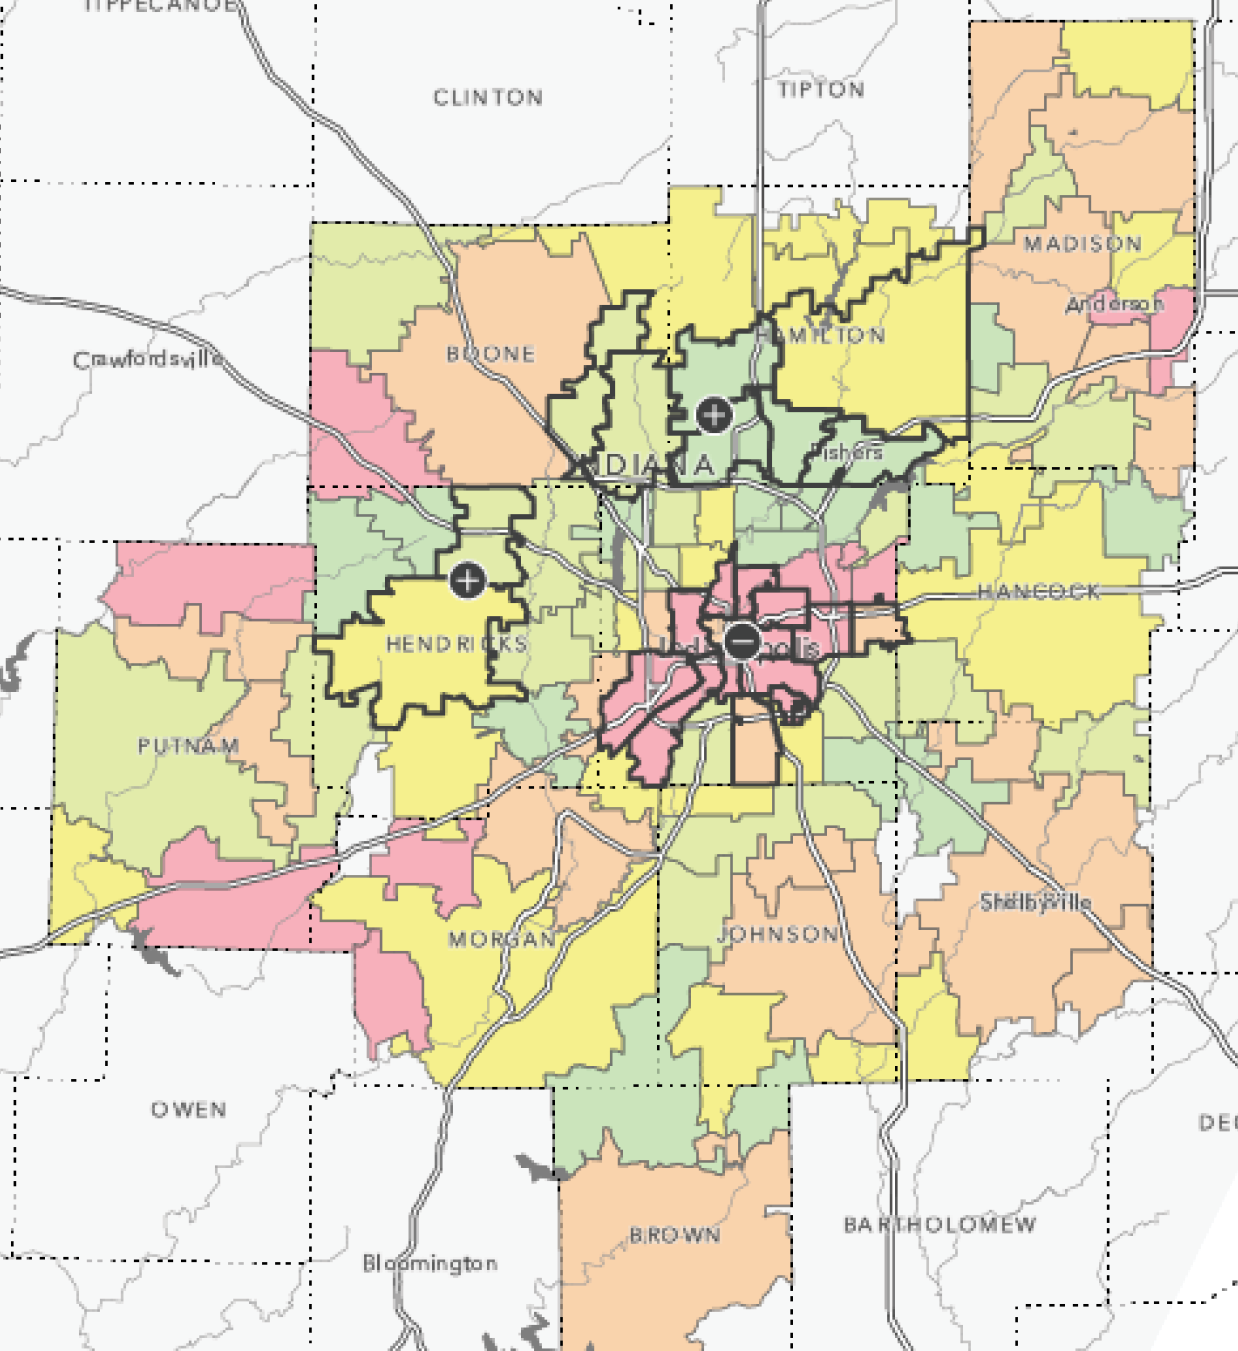
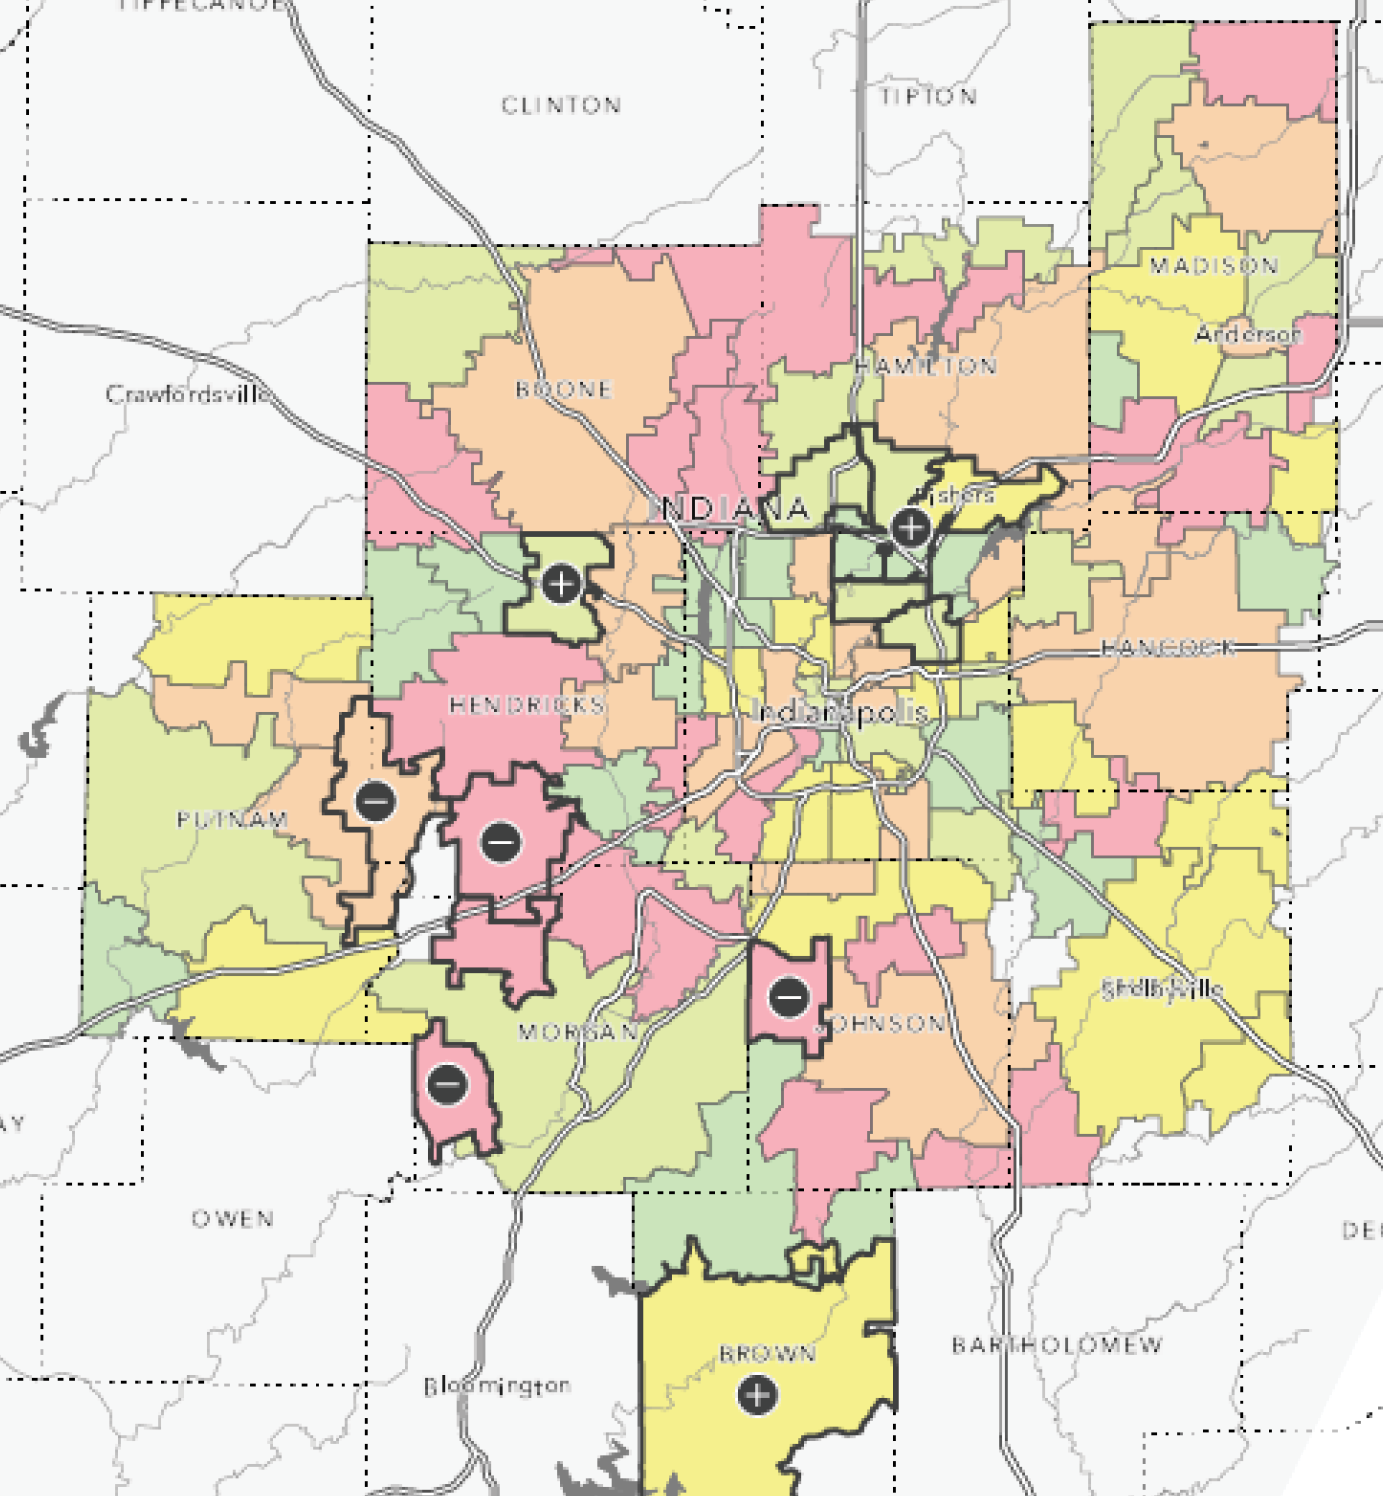
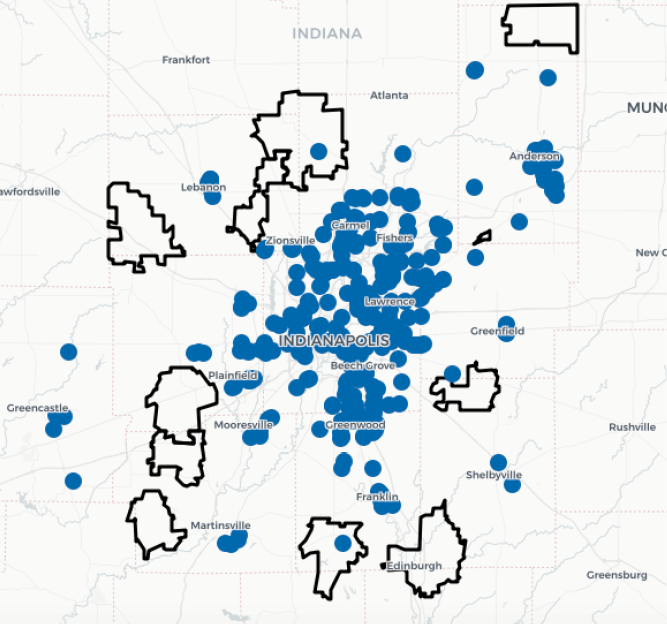
At birth, life expectancy is lowest in the urban core of Indianapolis and highest in the northern and western suburbs. High and low life expectancy are very geographically clustered, meaning ZIP codes with similar life expectancies are located near each other in a way that is unlikely to be random. This pattern is consistent through age 45, when clusters of high and low life expectancy are still in the same locations.
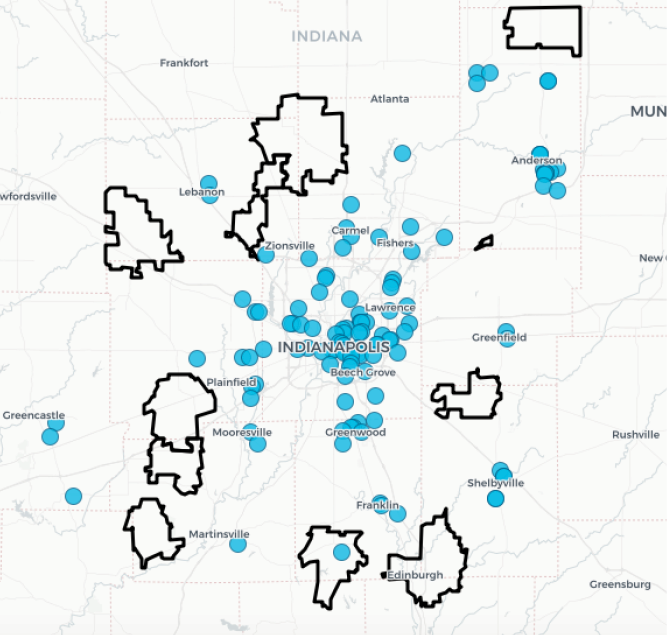
The pattern shifts for older adults. For people who survive to age 75, the center of Indianapolis is no longer a cluster of low life expectancy. Instead, those ZIP codes show a mix of high, low, and average life expectancy.
Life expectancy at birth
Life expectancy at age 45
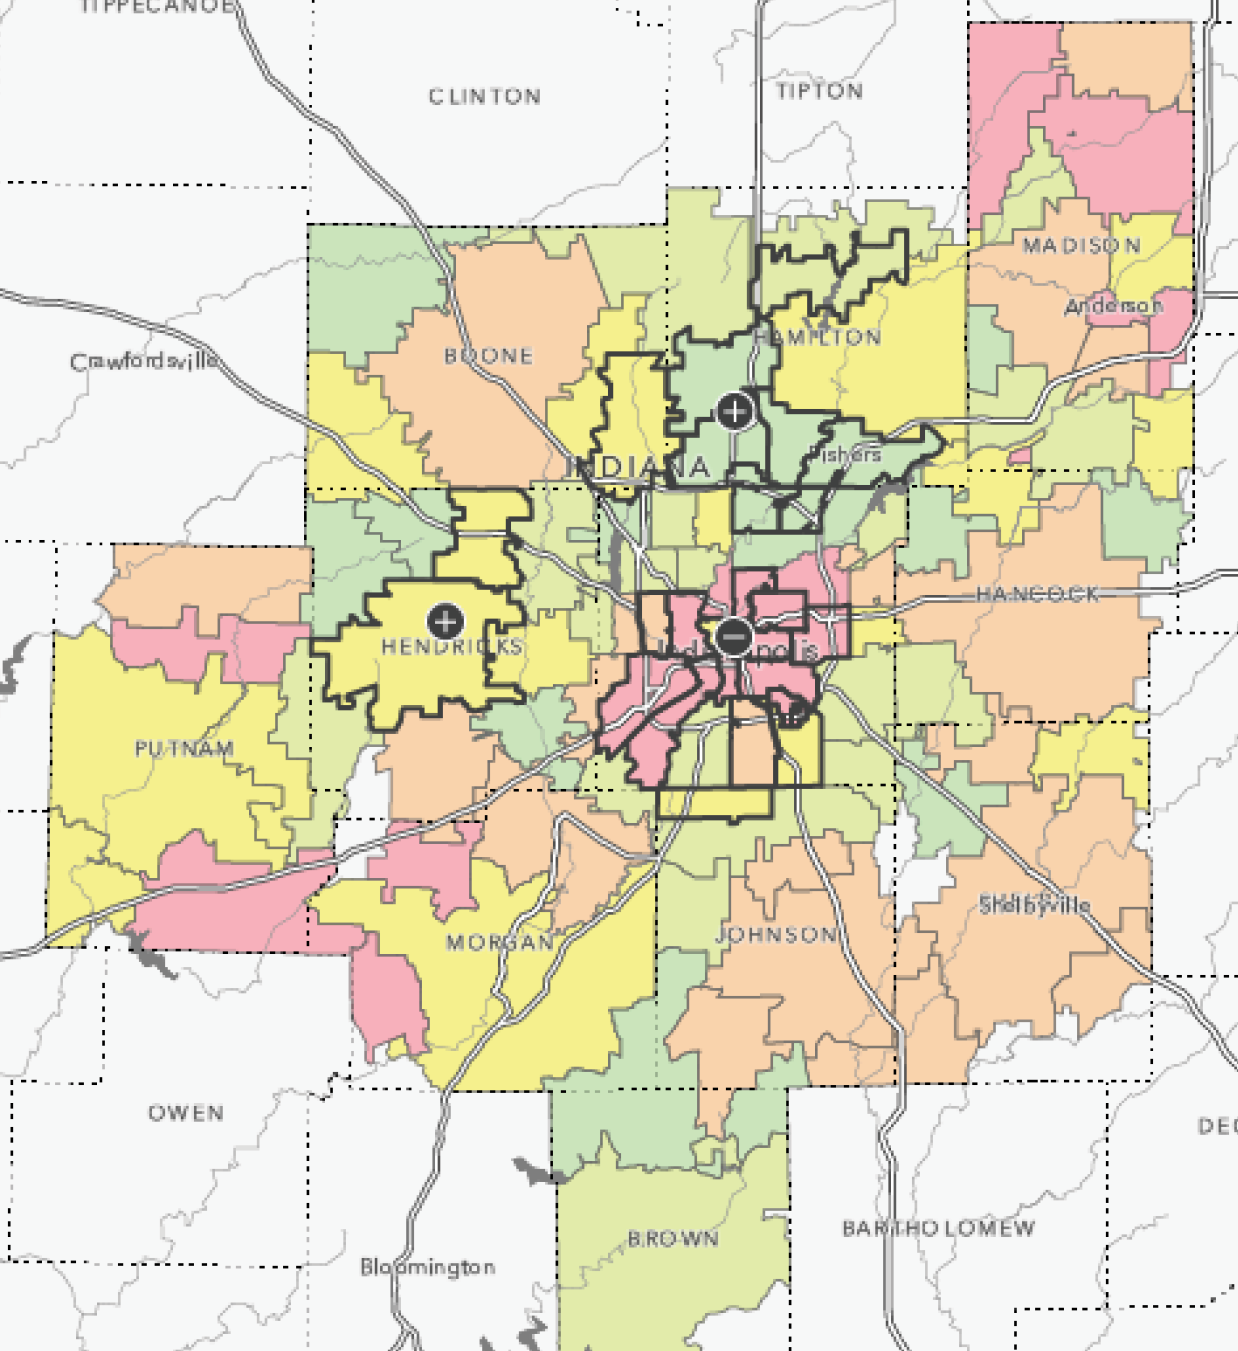
Life expectancy at age 75
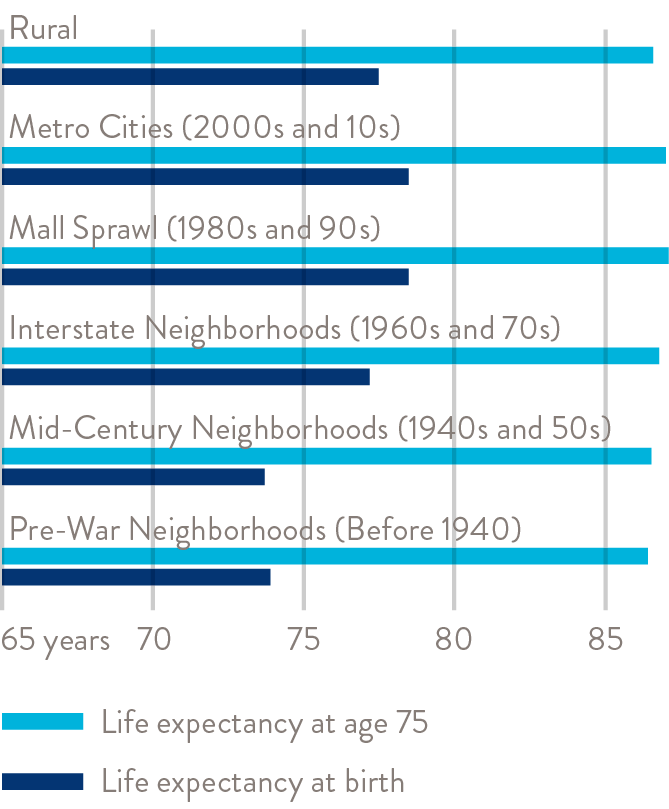
Life expectancy at birth shows a clear inequity between inner-city neighborhoods and suburban or rural places, but this pattern does not exist for life expectancy at age 75. The chart above uses development bands to classify ZIP codes by the period in which most of the housing stock was built. This provides useful grades from urban to suburban to rural. For more about this methodology, see The Changing Landscape of Poverty.
At birth, Pre-War neighborhoods (built before 1940) and Mid-Century neighborhoods (built in the 1940s and 1950s) have markedly lower life expectancy than newer, outlying areas. These urban, suburban, and rural distinctions have no relationship to life expectancy at age 75. In each development band, the average 75-year can expect to live to around 86 or 87 years old.
Barriers to Long Life for Older Adults
While neither density nor urban and rural classification are correlated with life expectancy, most of the ZIP codes with the lowest life expectancy for older adults are in rural areas. There are 19 ZIP codes where 75-year-olds’ life expectancy is cut short by at least one year compared to the median. 11 of these are rural areas with fewer than 56 housing units per square mile.
Therefore, many older adults face challenges in accessing healthcare. Over 13,000 older adults (age 55+) live in these 11 ZIP codes, and there is only one hospital (Witham Health Services at Anson). The map below shows many of the ZIP codes are significant distance from towns and cities with hospitals. The same is true for clinics and pharmacies.
Transportation to medical appointments can be difficult in these rural areas. Older adults have called the 2-1-1 helpline with transportation needs in many of these ZIP codes. While there are systems in place to assist with these needs (paratransit services for qualified individuals and Medicaid reimbursed travel expenses, for example), there are policy issues that still leave a gap.
One study found that a lack of vehicles like buses and shuttles is a barrier to serving older adults’ transportation needs. For example, a Hamilton County senior center sees 800 ride requests go unmet each month due to a shortage of vehicles in its fleet. The economics of rural transportation make this problem challenging to solve. Low population makes it difficult for rural areas to generate taxes to support a robust transit system, and low population density makes it inefficient to serve rural areas. Medicaid is an important source of transportation for qualified older adults in need of medical transportation. However, Medicaid only reimburses travel that occurs when the patient is in the vehicle. This policy can hurt the overall operating costs of rural transportation providers, as they often must drive more unreimbursed miles to pick up a passenger due to larger distances between businesses and residences in rural areas.
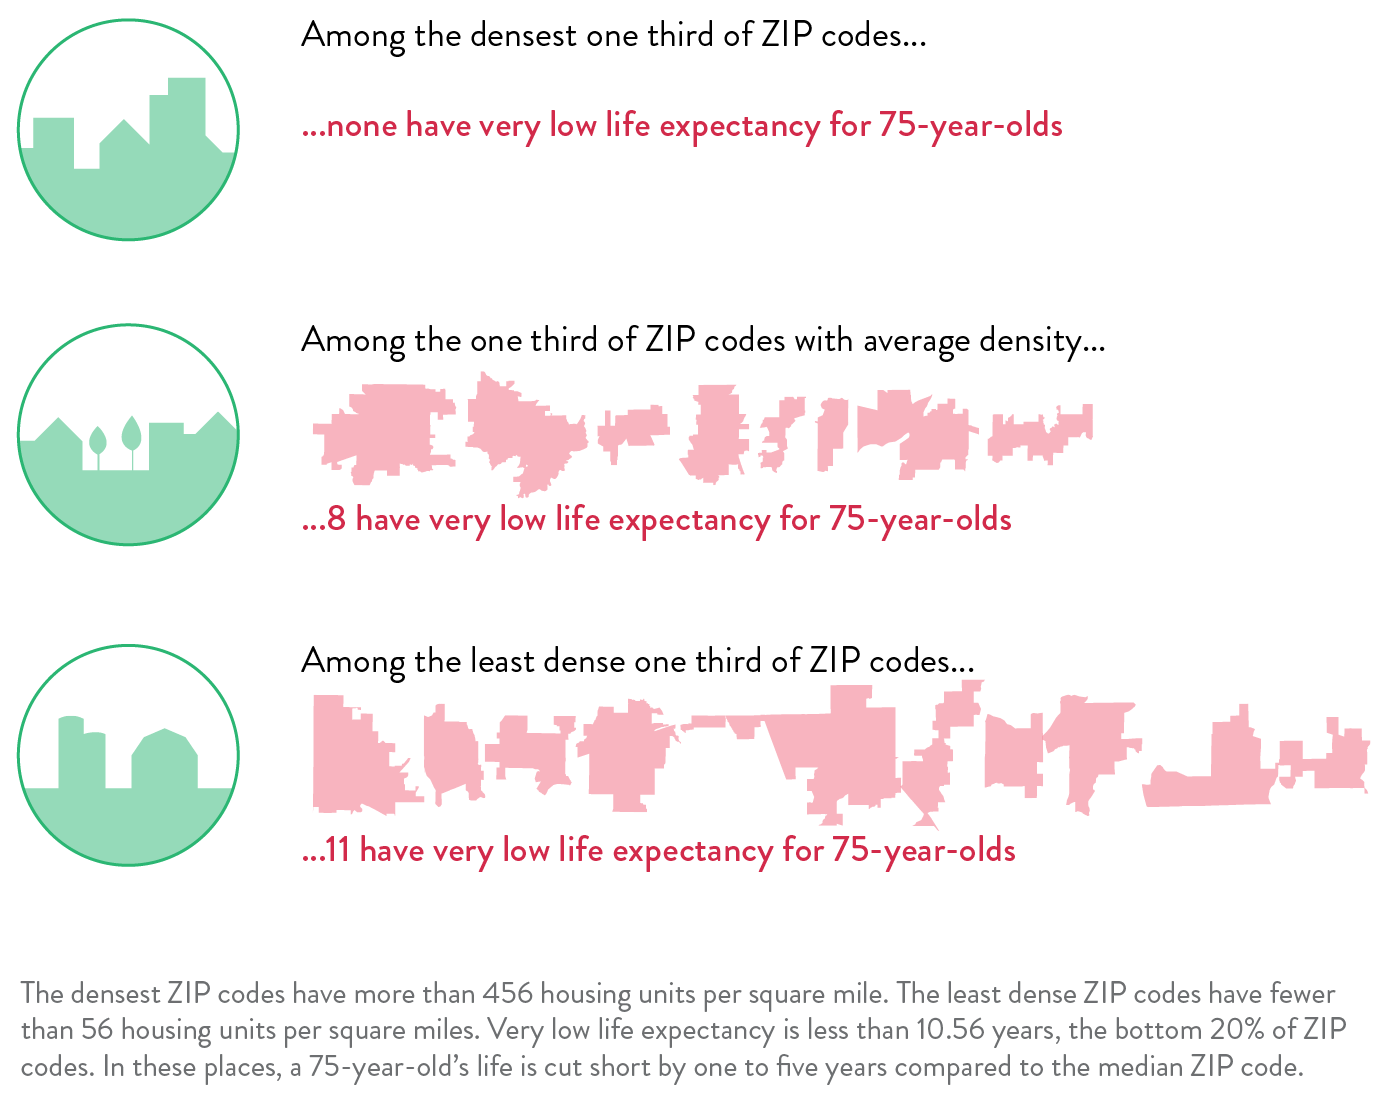
Average life expectancy for ZIP codes in each development band
Further Research into Life Expectancy Gaps for Older Adults
The conditions that explain life expectancy at birth are not effective at explaining life expectancy at age 75. There is no correlation between a ZIP code’s life expectancy at age 75 and poverty levels, social vulnerability measures, and education level. In fact, there is only a moderate correlation between life expectancy at birth and life expectancy at age 75.
To understand how to address life expectancy gaps, we need to understand what conditions might explain or cause different outcomes in different places. It may be that in rural areas, ZIP codes are not the most useful geography for understanding special differences in life expectancy. Rural ZIP codes are large and can contain varied places: small towns, agricultural areas, low-cost housing, expensive estate subdivisions, and more. When the places of disparate socioeconomic character are averaged together into one ZIP code measure, it may obscure important trends. Personal characteristics, conditions, and behaviors become important in understanding life expectancy.
The pop singer posted the above video, in which she tries to fully open her unnaturally closing eye by pressing on her temple. According to the celebrity, the abnormal blinking was actually part of a puppet image she reincarnated into for the show, dressed up in a shiny sequined mini-dress. “Greetings to all my conspiracy theory buffs who are coming to see my broken doll eye stunt in real life in Vegas next year!” – Perry explained her behavior in the video, which went viral on social media. In September 2020, Katy Perry and Orlando Bloom Selena Gomez’s trembling hands in a video about applying makeup excited fans. The footage shows the celebrity applying different makeup products to her pre-cleaned face in stages. When she starts to make her eyes with a black liner, you can see how her hands are trembling.
However, the results of this analysis indicate that geography still plays an important role in life expectancy for older adults. At age 75, areas of low life expectancy tend to cluster together. Further analysis of a broader set of socioeconomic, demographic, and access measure may surface some unexpected correlates of life expectancy.
It should be noted that, when examining life expectancy for age 75, we are looking only at a subset of the population that has survived to age 75. It is likely that this population differs from the overall population. In a ZIP code like 46218, where the average life expectancy is 68 years old, fewer individuals survive to age 75 than in other ZIP codes. These residents may differ substantially from the overall population in terms of health conditions and behaviors.
Method notes
Life expectancy represents the average based on records from 2013-2018.
To identify if life expectancy tended as either clustered, random, or dispersed, we used a spatial statistic called Global Moran’s I. This measures a phenomenon known as autocorrelation, when neighboring areas tend to be statistically similar or dissimilar. The statistic ranges from -1.0 (perfectly dispersed, meaning no neighbors are similar) to 0.0 (perfectly random), to 1.0 (perfectly clustered, meaning all neighbors are similar). Global Moran’s I was 0.34 for life expectancy at birth (10.1 z-score), 0.27 at age 45 (8.2 z-score), and 0.05 at age 75 (1.9 z-score). Therefore, we can be statistically confident that the spatial patterns of life expectancy are not random at any age, but the clustering patterns are stronger earlier in life and weaker later life.
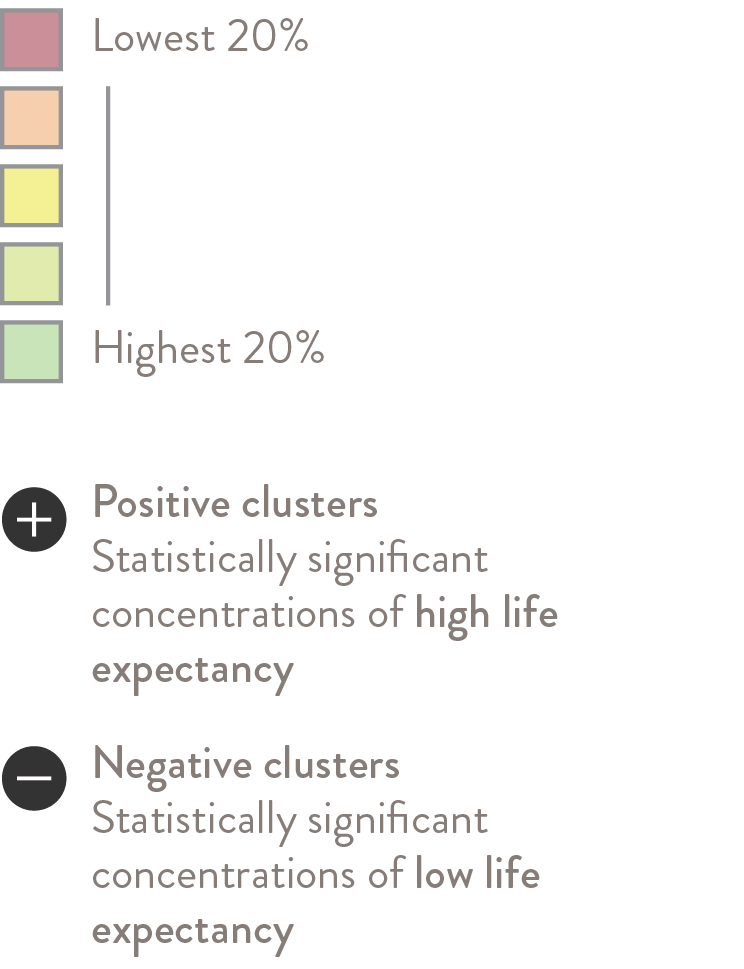
Positive and negative clusters were identified using a related statistic called Anselin Local Moran’s I. This identifies concentrations of low and high values, as well as places where values are different from expected based on neighboring values.
